For this class project me and my colleagues developed an end-to-end business intelligence solution analyzing Chicago traffic crash data to support a mock insurance company decision-making through dimensional modeling, ETL pipelines, OLAP cubes, and interactive Power BI dashboards.
The complete project is available on GitHub at lds-dw-modelling. Collaborating with my colleagues, we divided responsibilities across data cleaning, schema design, ETL development, OLAP implementation, and dashboards creation. The classes taught me the complete data warehousing lifecycle from raw data to actionable business insights and I and my colleagues applied those concepts in the project.
This project was my first opportunity to apply the comprehensive data warehousing and OLAP concepts taught throughout the Decision Support Systems course. While the lectures provided the theoretical foundation, implementing a complete business intelligence solution from raw data to interactive dashboards revealed the practical complexities and trade-offs inherent in real-world DSS development.
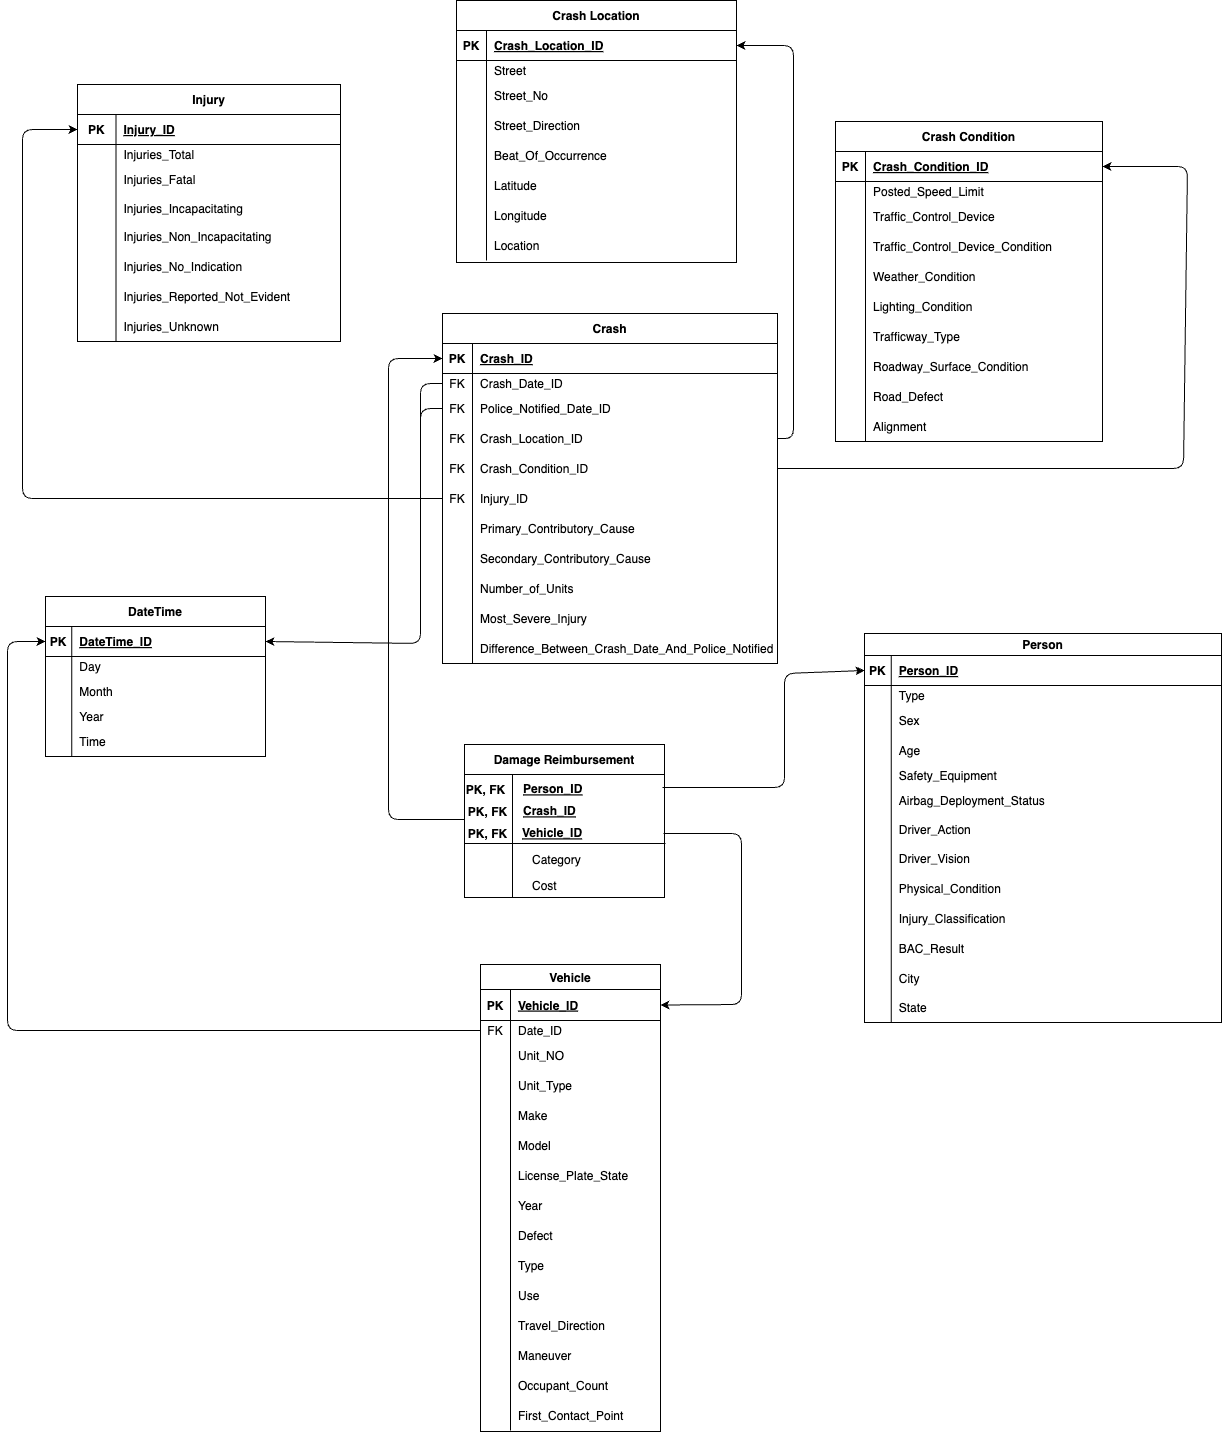
In class, we learned about dimensional modeling, the distinction between fact tables and dimension tables, the principles of star and snowflake schemas, and the importance of grain definition. When we designed our fact table, these principles came to life. The decision to use a snowflake schema rather than a pure star schema wasn't arbitrary, it directly applied the course material on normalization trade-offs.
The lectures explained that snowflake schemas reduce redundancy by normalizing dimension tables, but at the cost of more complex queries requiring additional joins. Our choice to normalize some dimensions into more sub-dimensions showed us this trade-off.
The course covered ETL (Extract, Transform, Load) processes and the critical importance of data quality in decision support systems. Lectures emphasized the 80/20 rule: 80% of a data warehousing project's effort goes into data cleaning and ETL, with only 20% on reporting and analysis. I initially thought this was an exaggeration, but after spending weeks on data preprocessing, transformation, and quality validation, I completely understand it now.
The SSIS (SQL Server Integration Services) classes taught us about the core transformation components: Lookup, Derived Column, Conditional Split, Aggregate, and Sort. In the project we used those tools in a chain to create complex data flows.
The lectures on data quality dimensions turned out to be very useful when we handled missing values across numerous columns in the provided tables. The course taught us to document data quality decisions and establish business rules for handling anomalies.
One aspect we had to figure out beyond the course material was the geocoding API integration for recovering missing latitude/longitude values. The lectures covered external data enrichment conceptually, but the practical challenges of API use required independent problem-solving.
The OLAP (Online Analytical Processing) lectures introduced us to multidimensional data modeling, measure groups, dimensions, hierarchies, and the fundamental operations of roll-up, drill-down, slice, and dice. The course used the classic sales data warehouse example which provided clear conceptual understanding.
The concept of calculated measures, introduced in class through examples like profit margins and year-over-year growth, became much more complex in our MDX queries. The course taught us the WITH MEMBER syntax and the CURRENTMEMBER function, but applying these to compute relative time calculations took significant experimentation. Understanding that MDX operates on dimensional contexts rather than row-by-row like SQL was essential, but internalizing it required writing failing queries, debugging, and gradually building intuition about when calculations execute in the MDX evaluation pipeline.
The MDX (Multidimensional Expressions) portion of the course introduced the basic query structure: SELECT on COLUMNS and ROWS, FROM the cube, WHERE for slicing. We learned key functions like TOPCOUNT, Filter, Hierarchize, NON EMPTY, and aggregate functions (SUM, AVG, MEDIAN, MAX). However, the course examples were relatively straightforward.
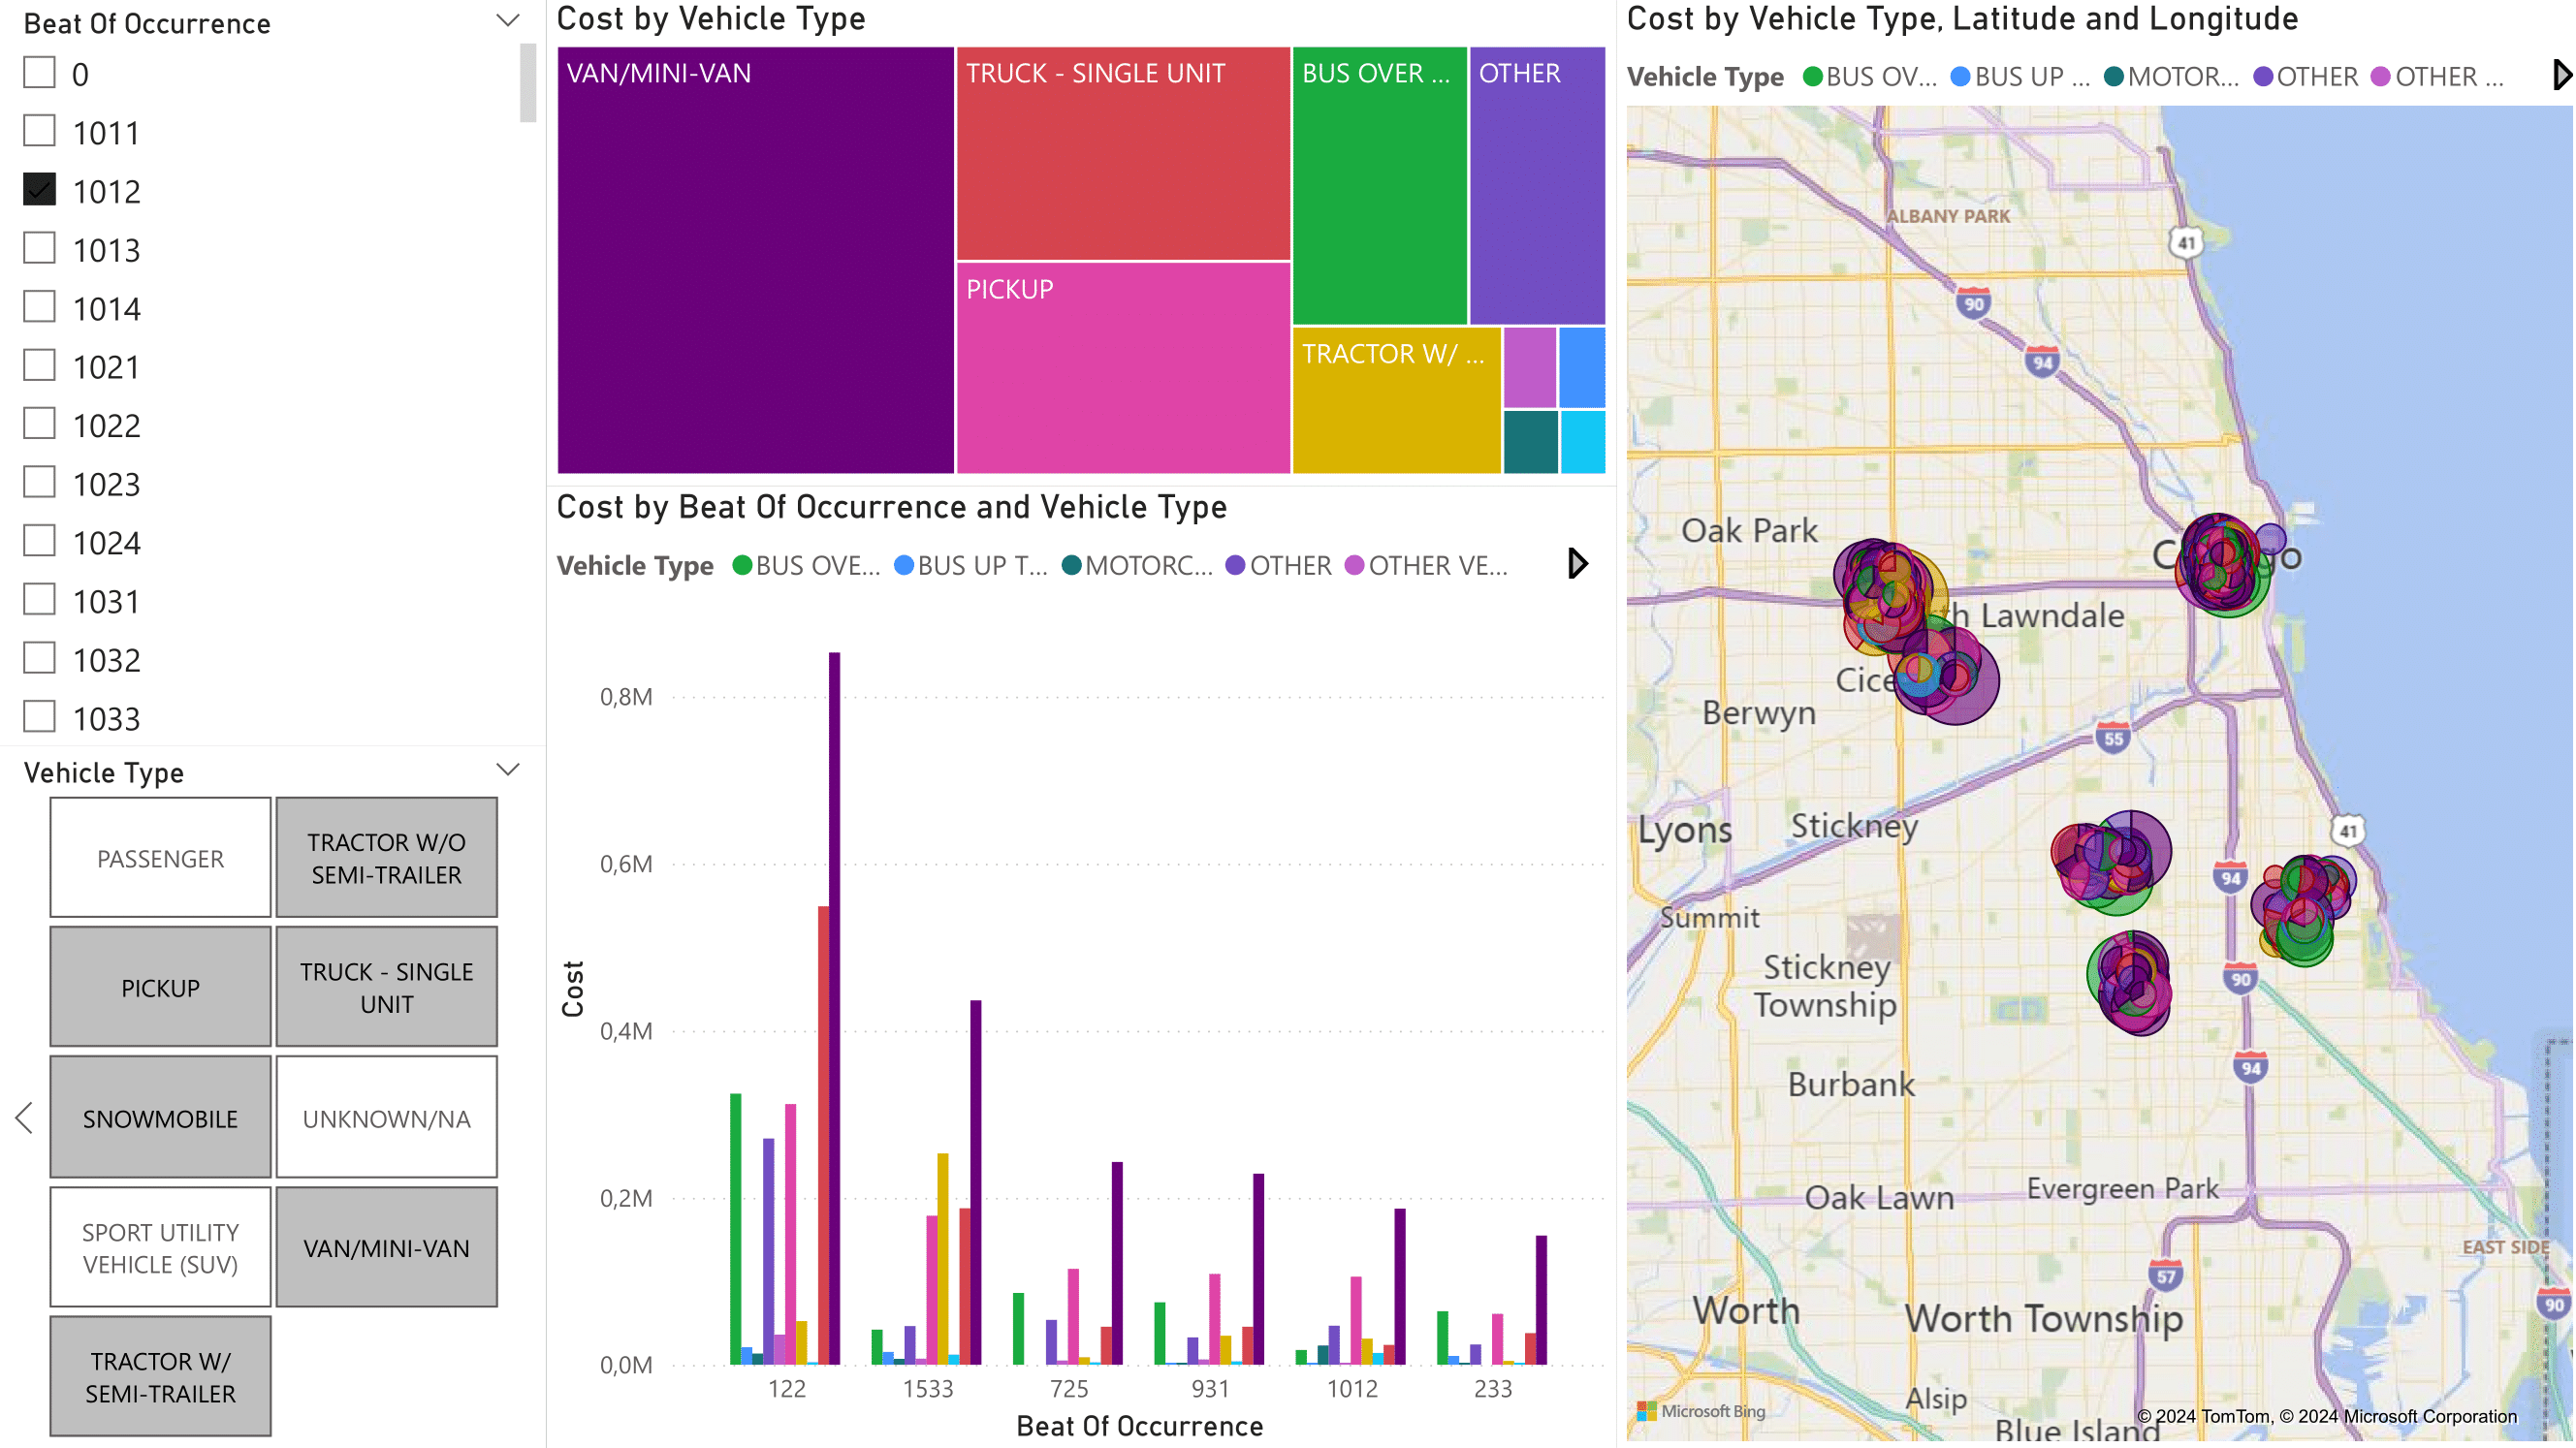
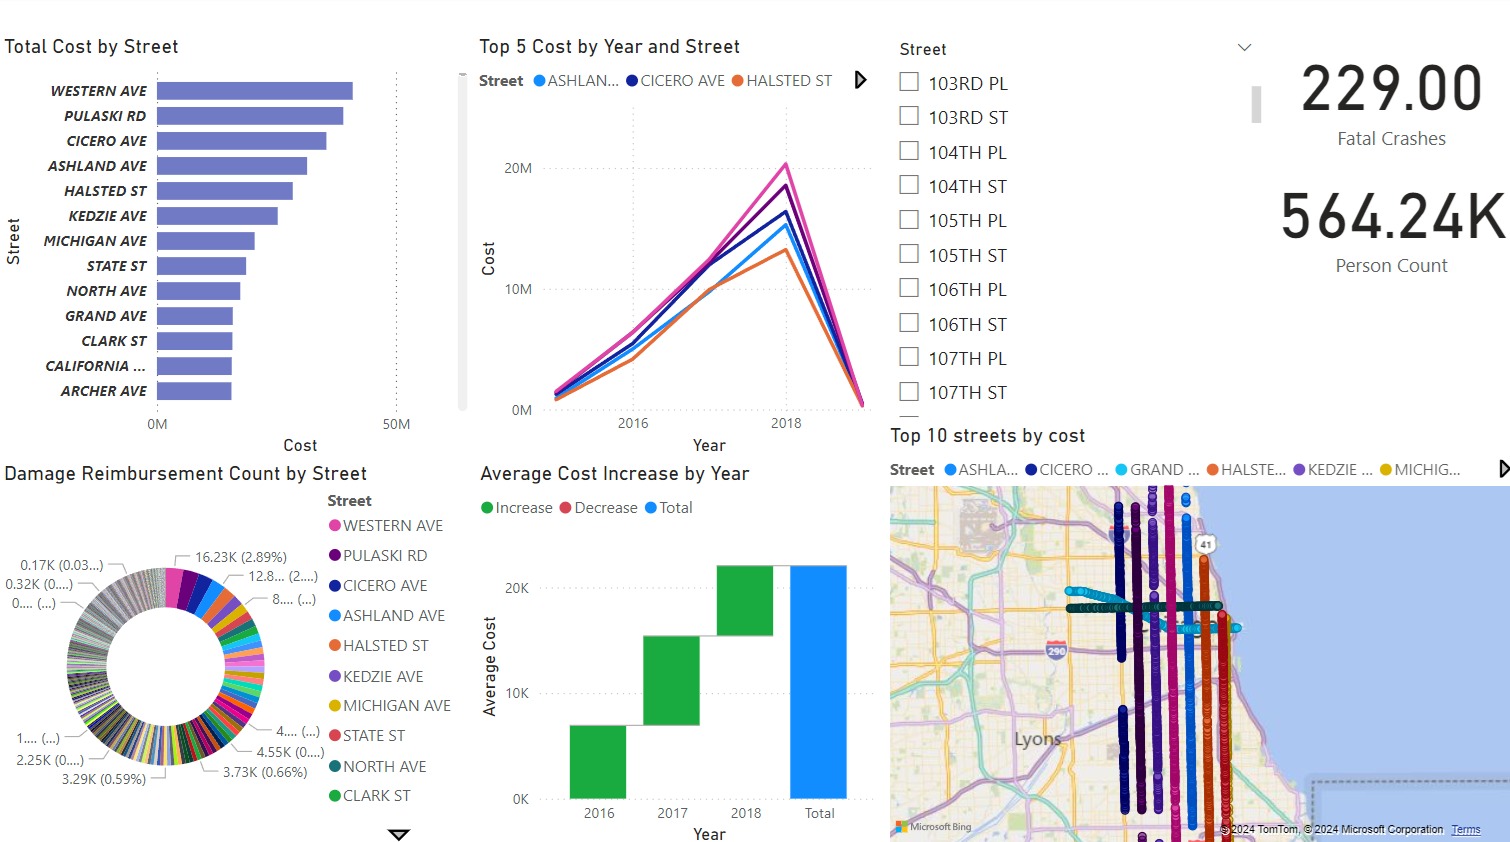
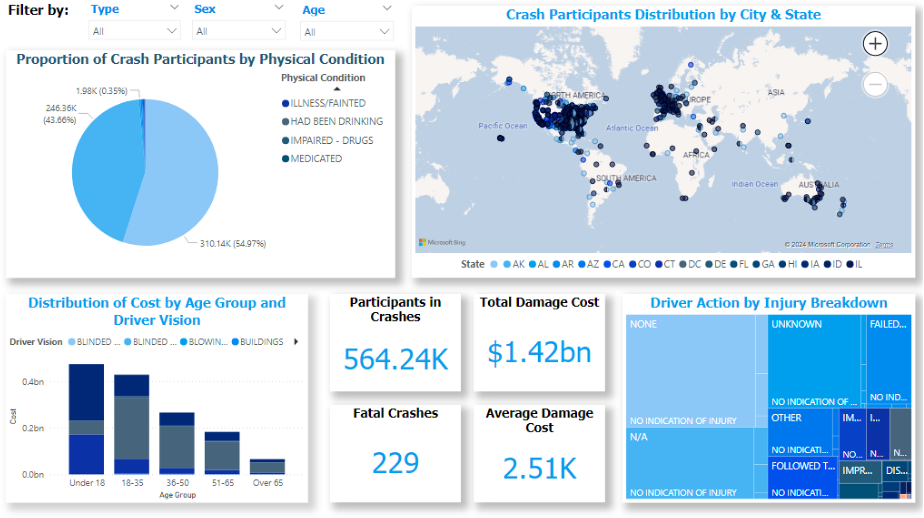
The course's final section covered dashboard design principles: identifying KPIs, choosing appropriate visualizations, enabling interactivity, and designing for different user roles. The lectures emphasized that dashboards should answer business questions, not just display data.
The performance optimization required for our 257,925 crash records pushed us to learn about indexing strategies, query execution plans, and OLAP cube processing optimization. The course mentioned that performance matters, but we had to independently research SQL Server index types, understand when to use clustered versus non-clustered indexes, and learn about SSAS partition strategies for large fact tables. When our initial cube processing took over 10 minutes, we implemented incremental processing, a technique we found in Microsoft documentation rather than course lectures.