As artificial intelligence systems become increasingly integrated into critical decision-making processes across healthcare, finance, justice, and other high-stakes domains, the need for transparent and interpretable explanations of machine learning predictions has become clear. My master's thesis project addresses the fundamental challenge of transforming complex explainability method outputs into intuitive visual representations that support exploration, confirmation, and understanding.
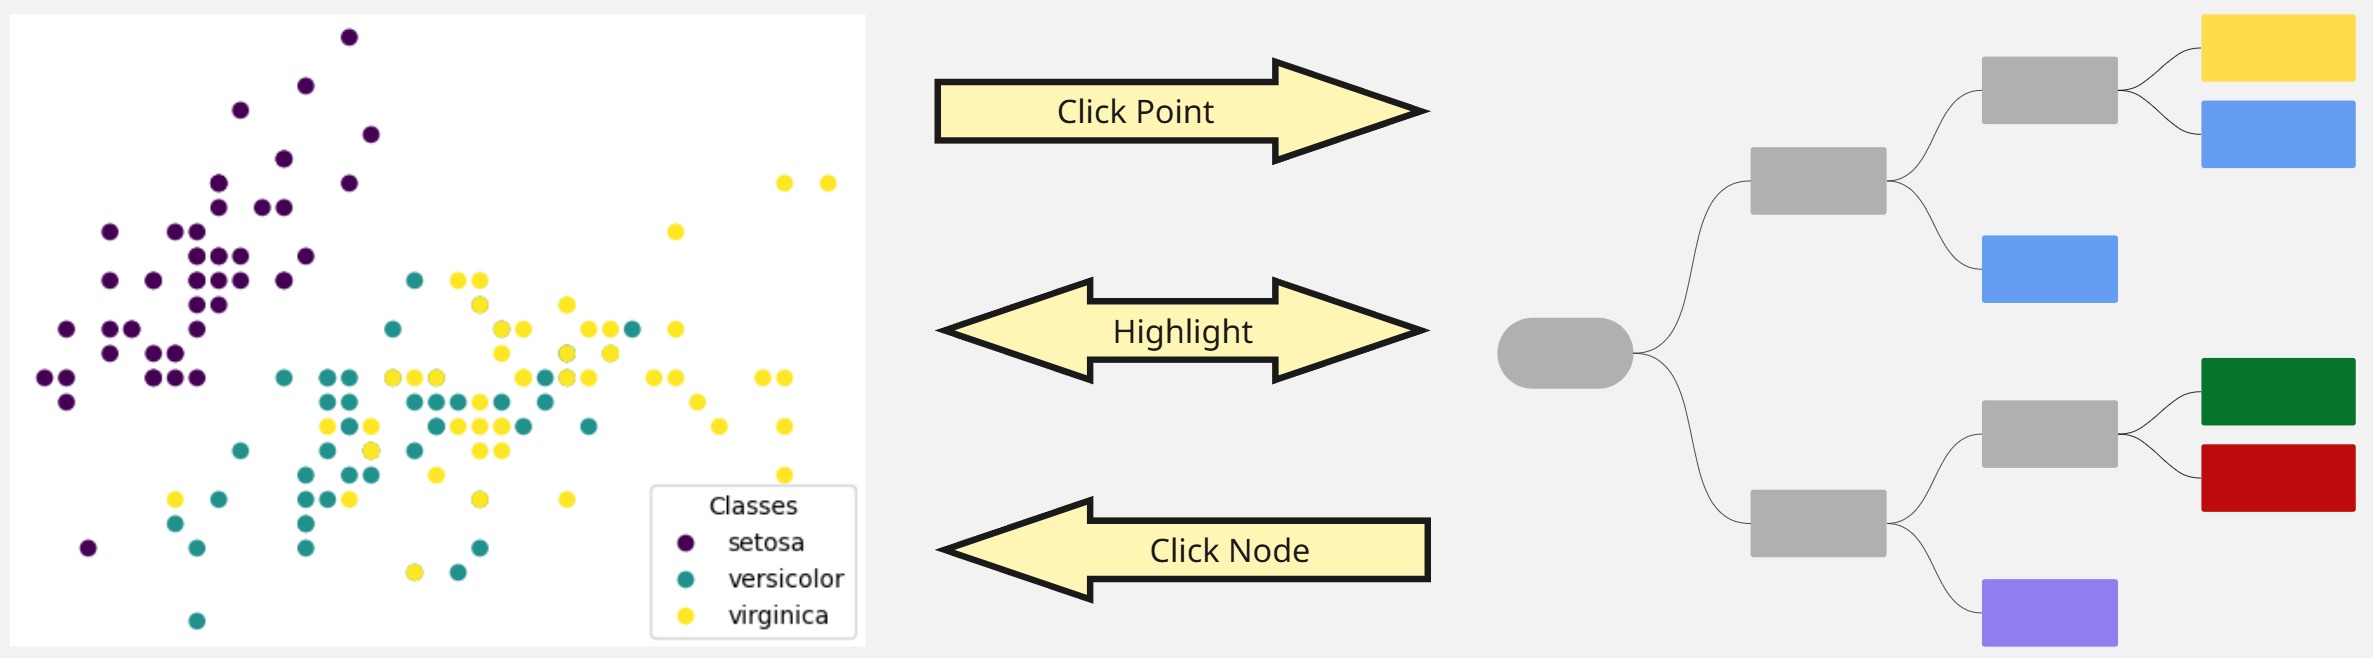
The proposed framework enables users to iteratively explore how local decision boundaries are captured by synthetic neighborhoods and how these neighborhoods translate into interpretable decision rules. Rather than relying on static textual representations that place significant cognitive burden on users, my system implements interactive visualizations that bridge the gap between algorithmic explanations and human understanding.
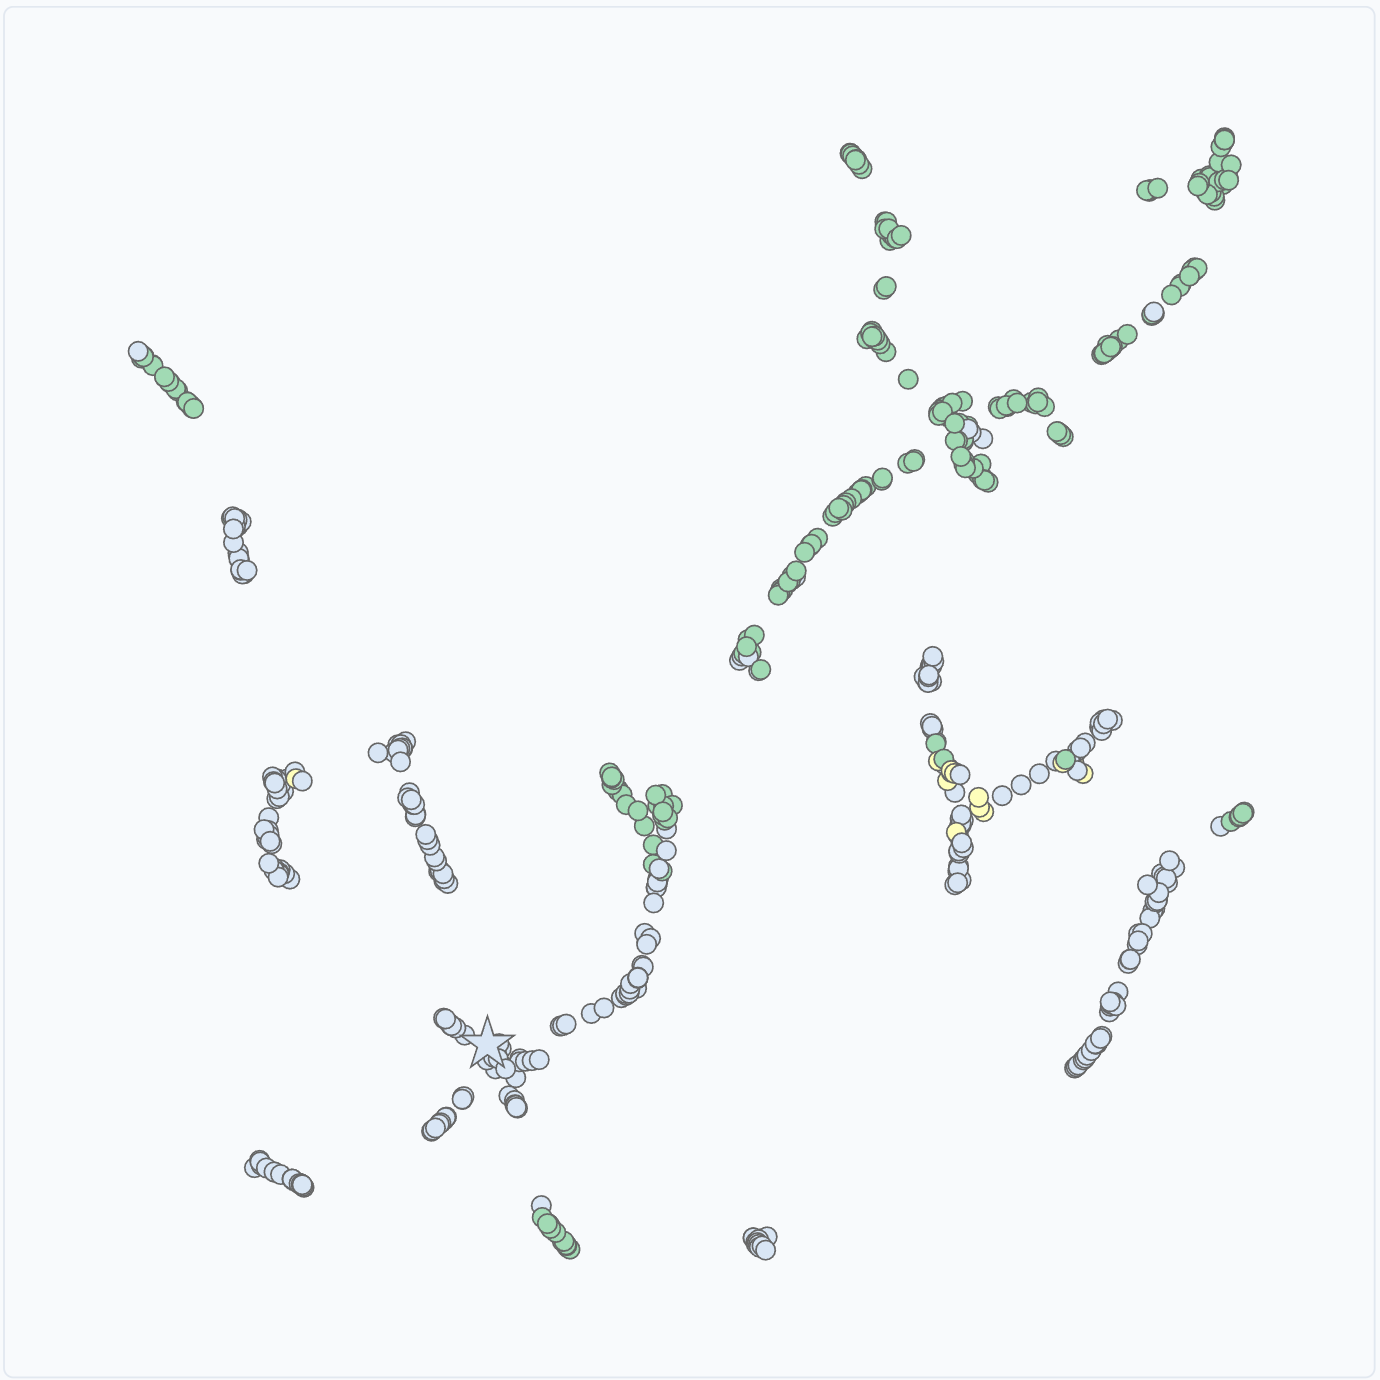
The system focuses on local explainability methods that generate synthetic neighborhoods around explained instances and extract rules through surrogate models. While implemented using the LORE sa (Stable and Actionable Local Rule-based Explanations) method, the framework's architecture could easily accommodate other state-of-the-art methods.
Through the thesis I gained insights into the intersection of explainable AI, information visualization, and human-computer interaction. I discovered that effective explanation communication requires more than sophisticated algorithms, it demands carefully designed interactive systems that support diverse analytical workflows and accommodate different cognitive preferences.
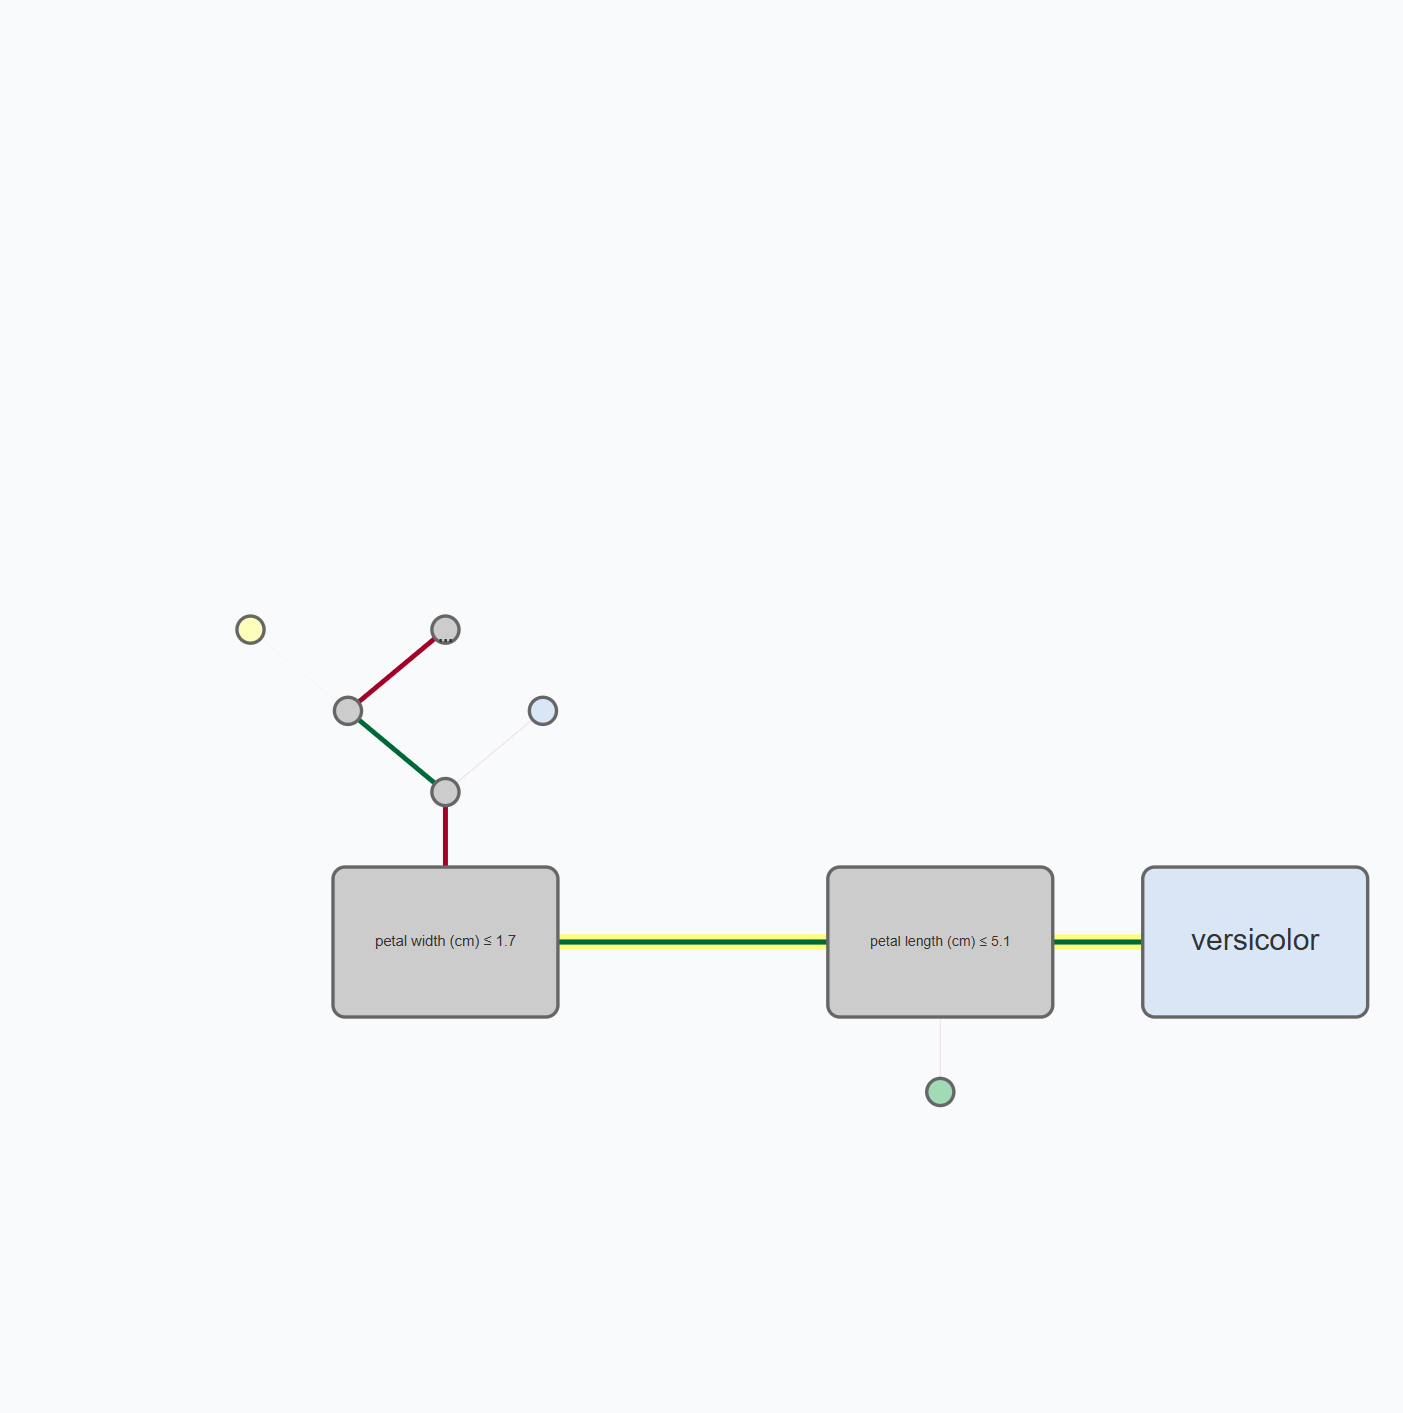
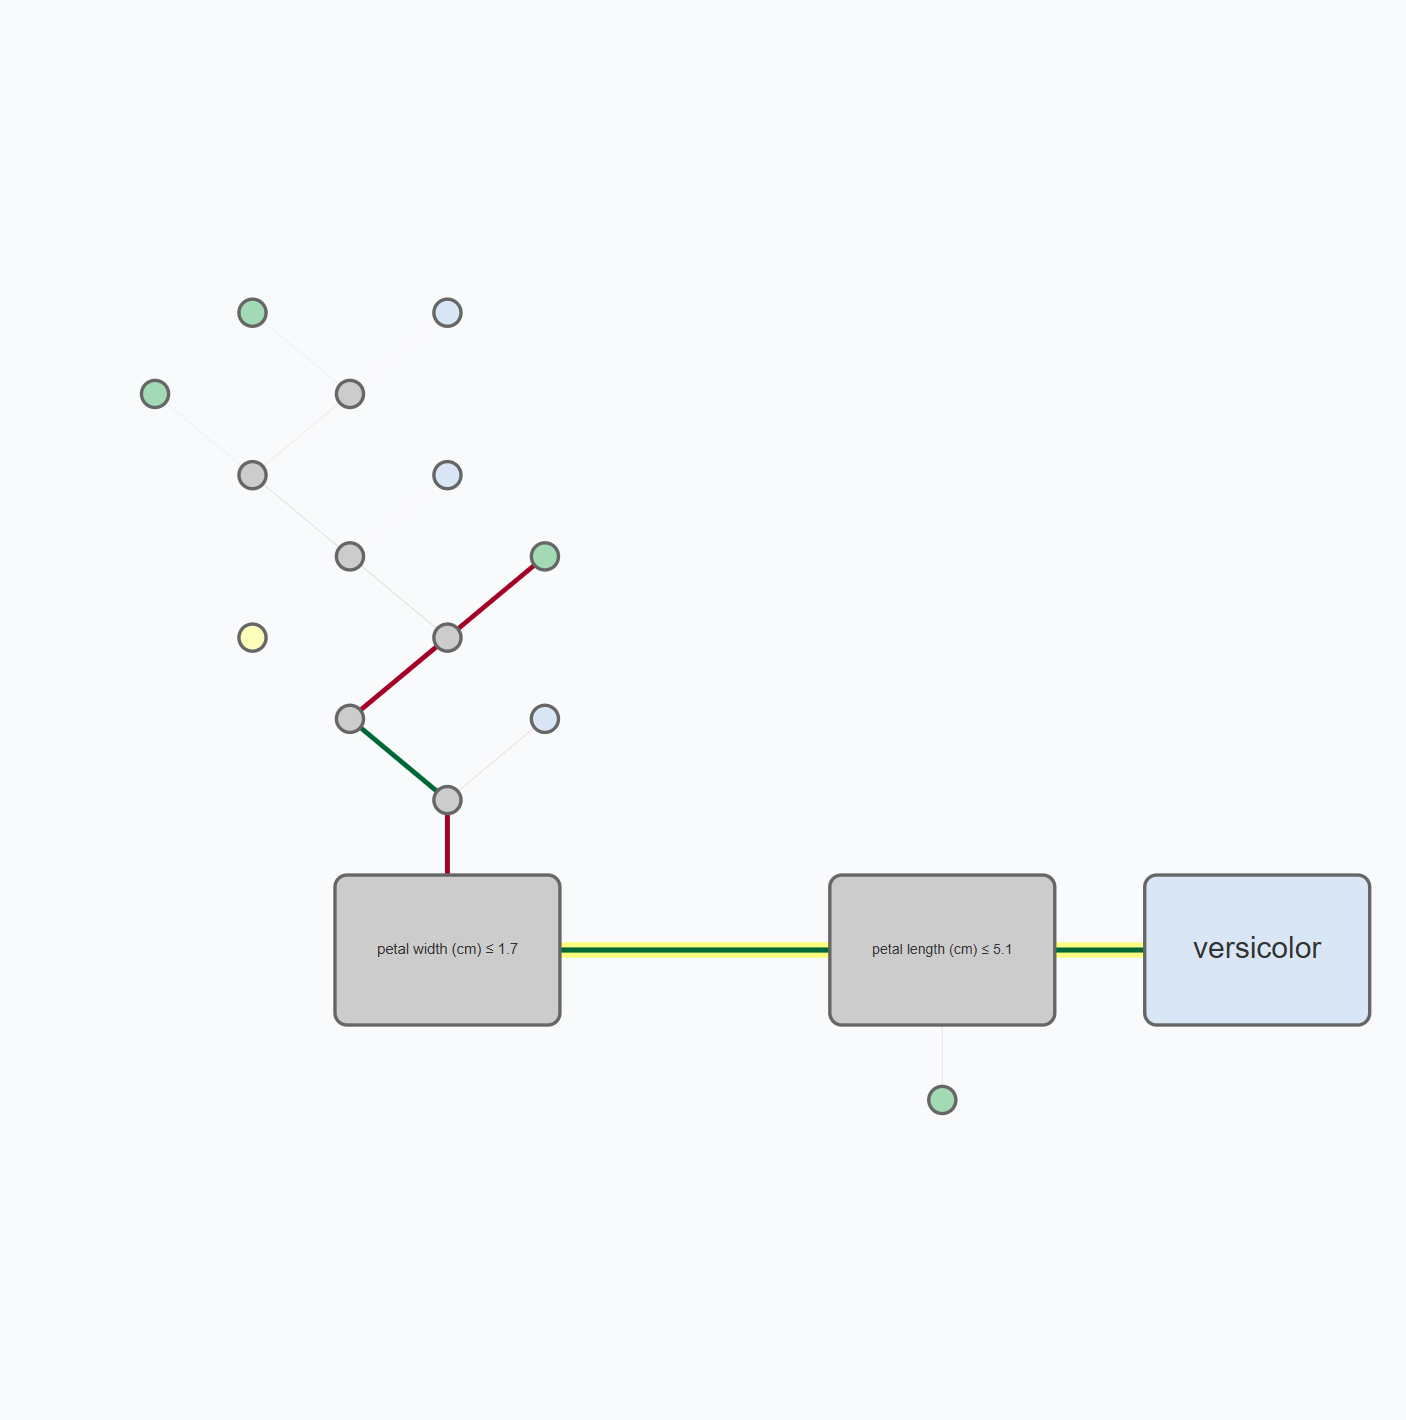
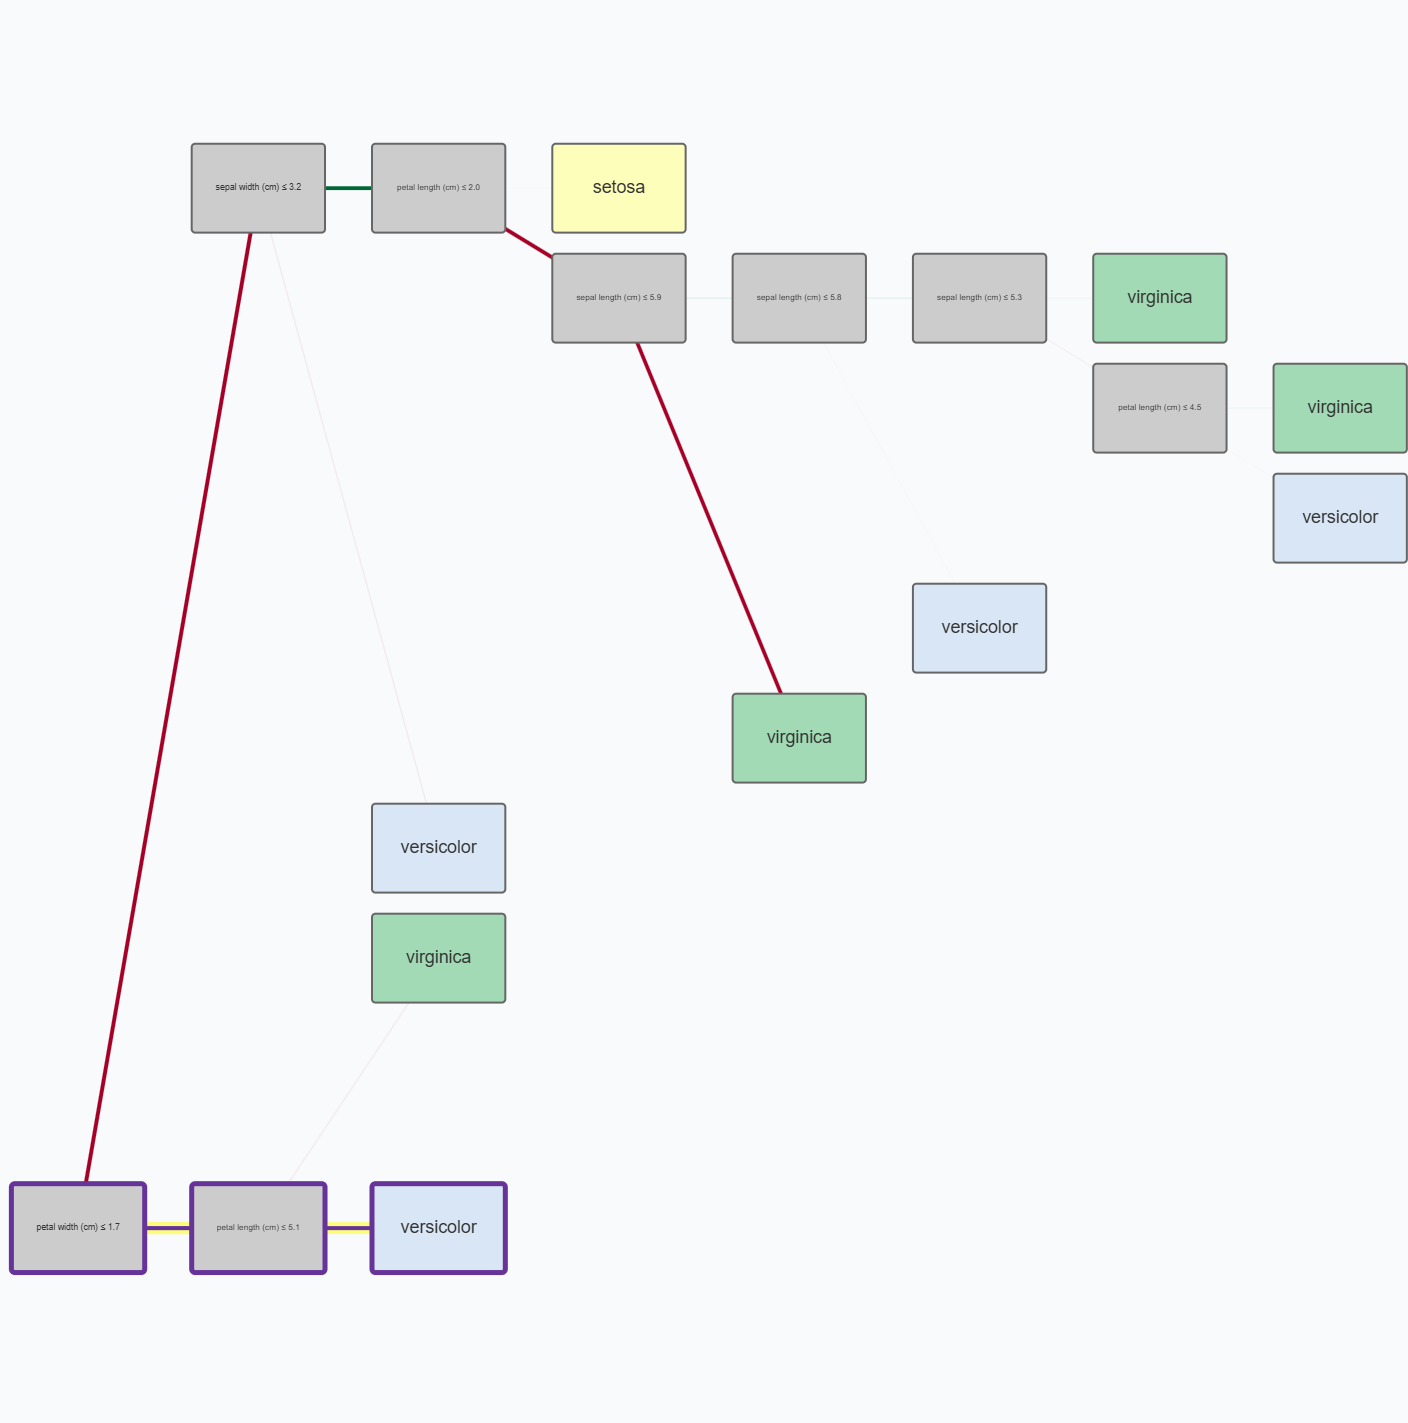
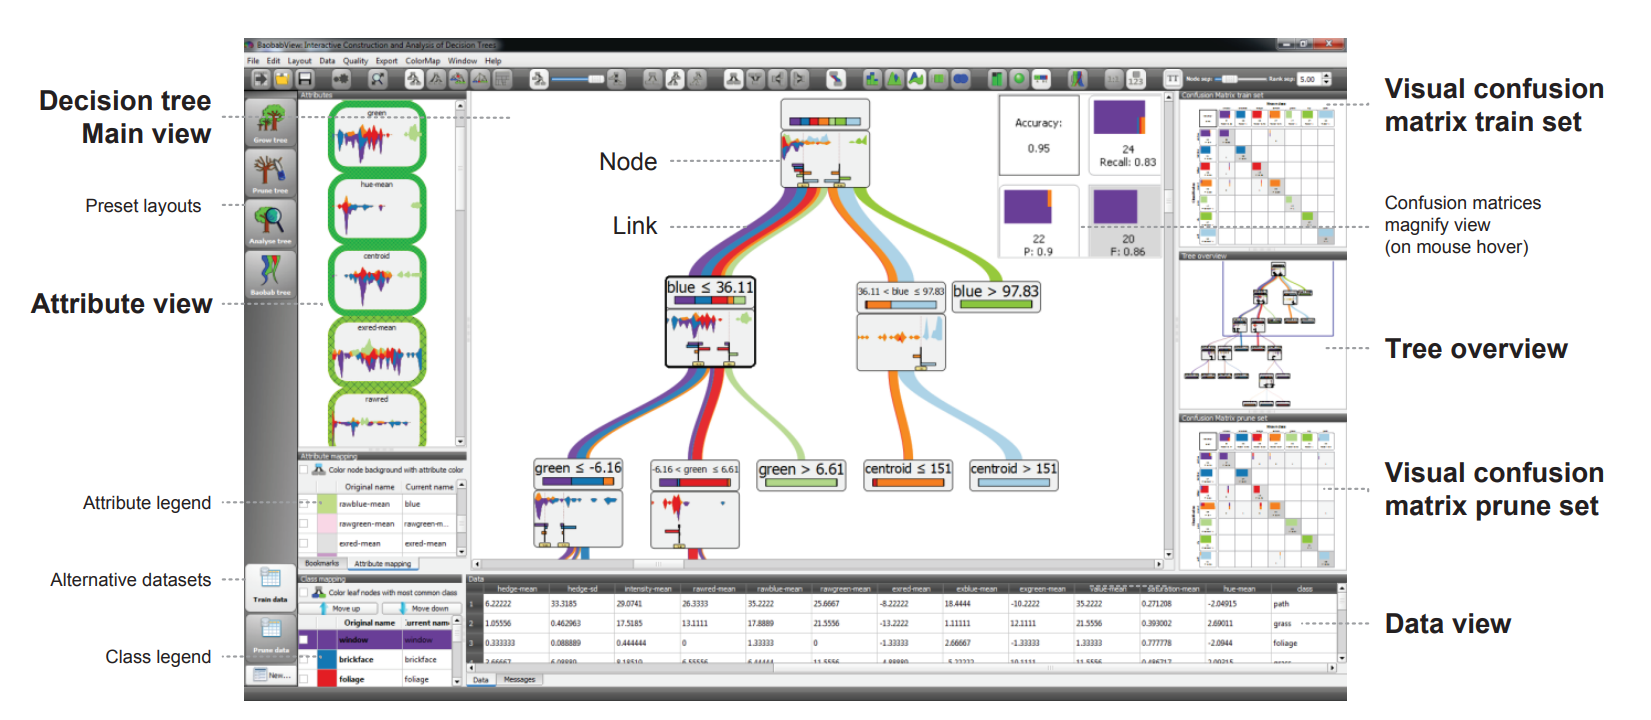
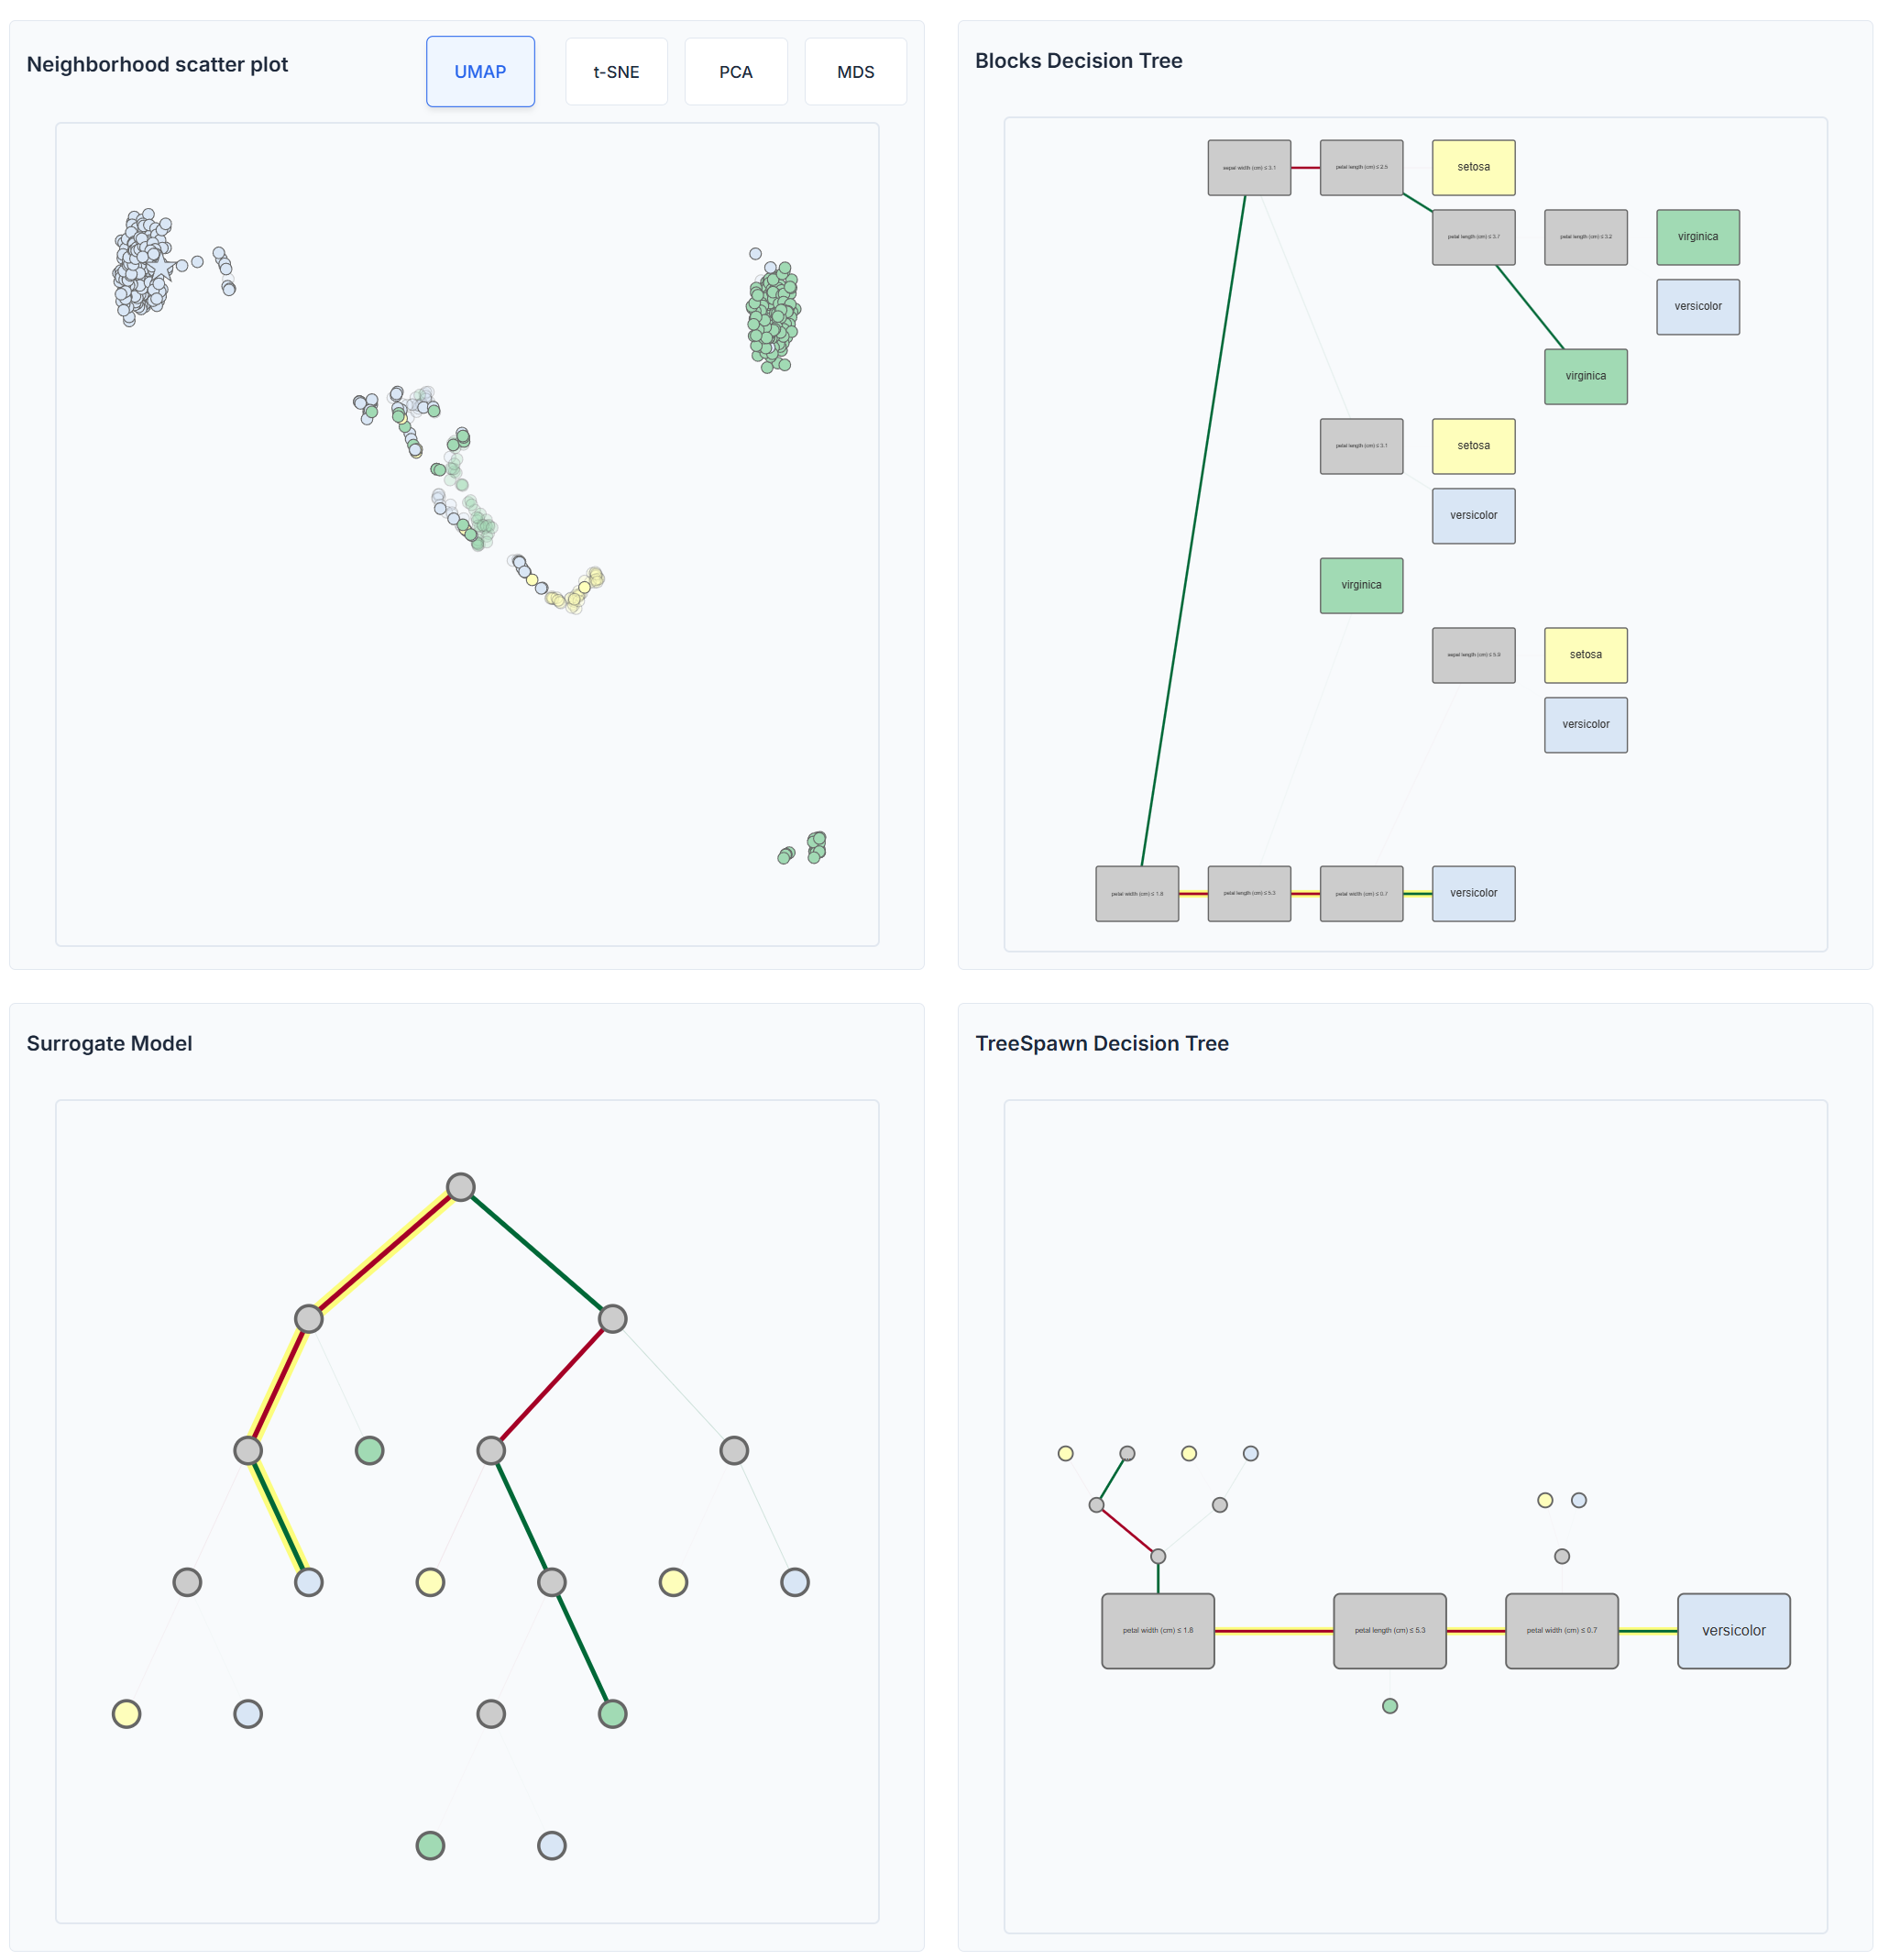
I learned the importance of coordinated multiple views in complex data exploration. By implementing bidirectional coordination between spatial neighborhood projections and hierarchical rule structures, I learned how enabling users to transition between spatial intuition and logical reasoning creates more powerful analytical capabilities than either representation alone.
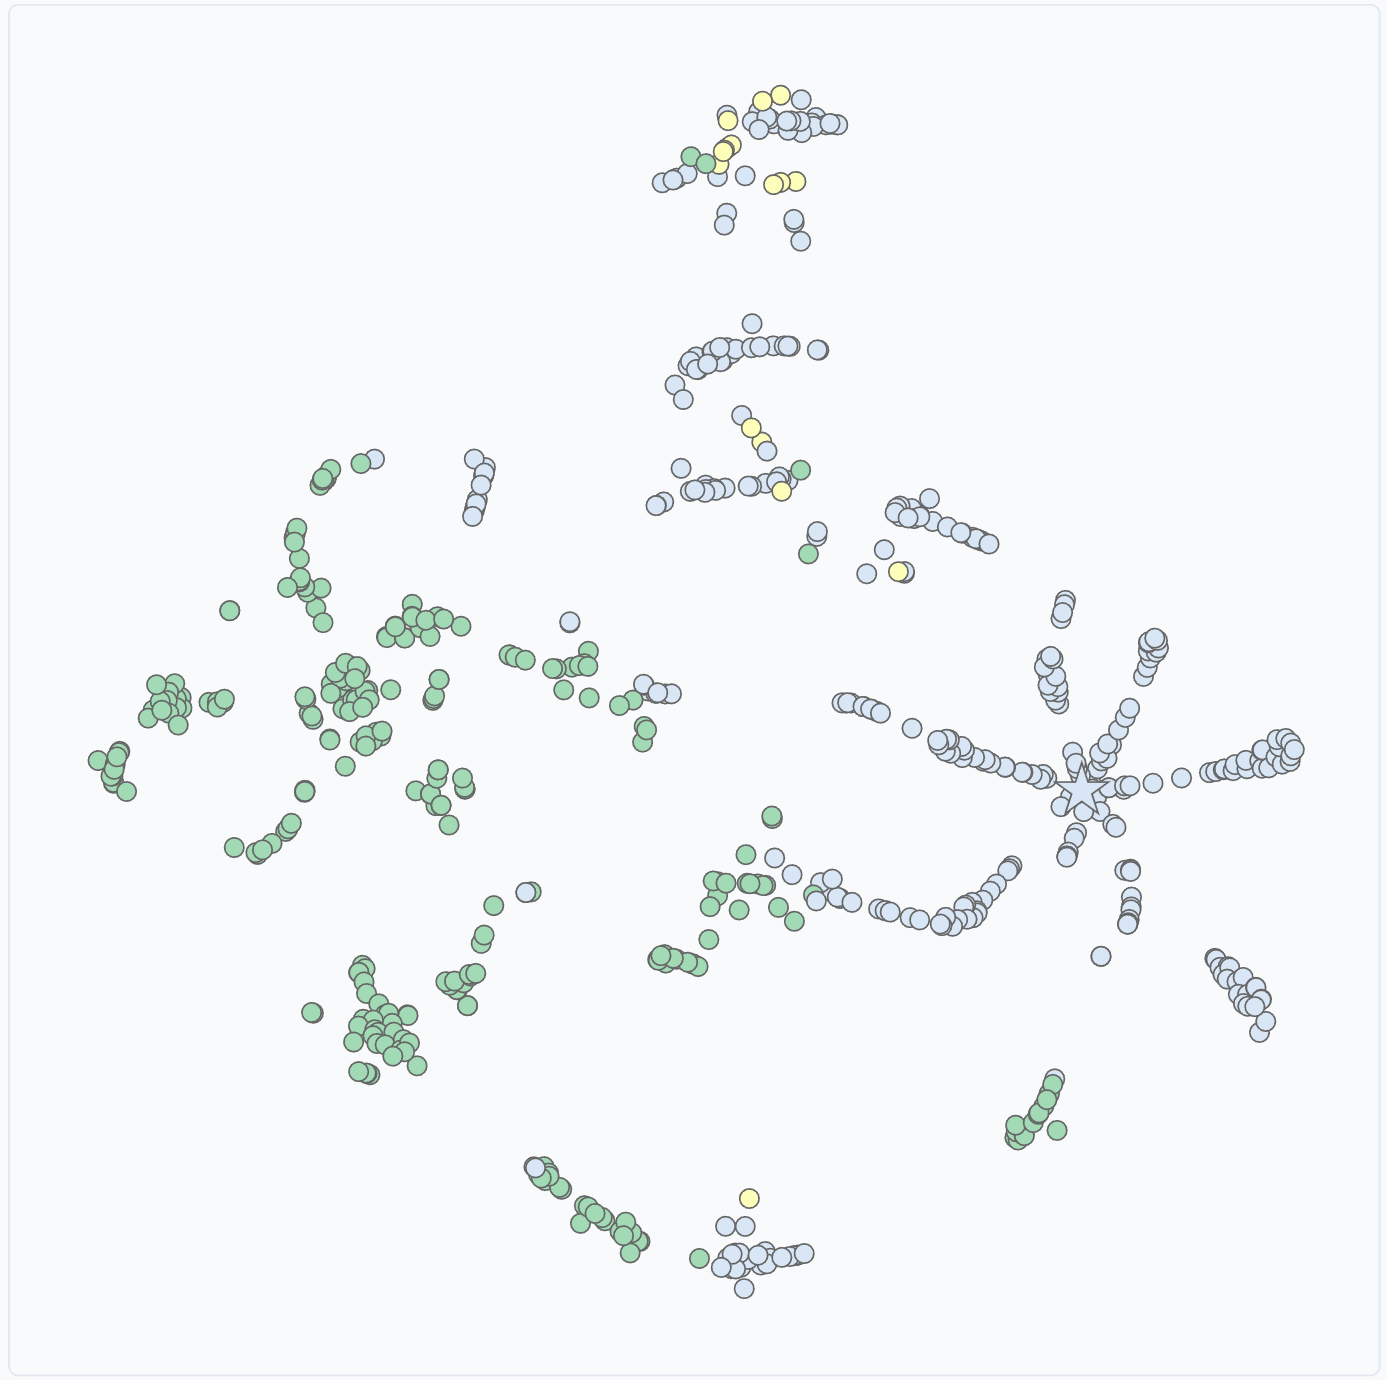
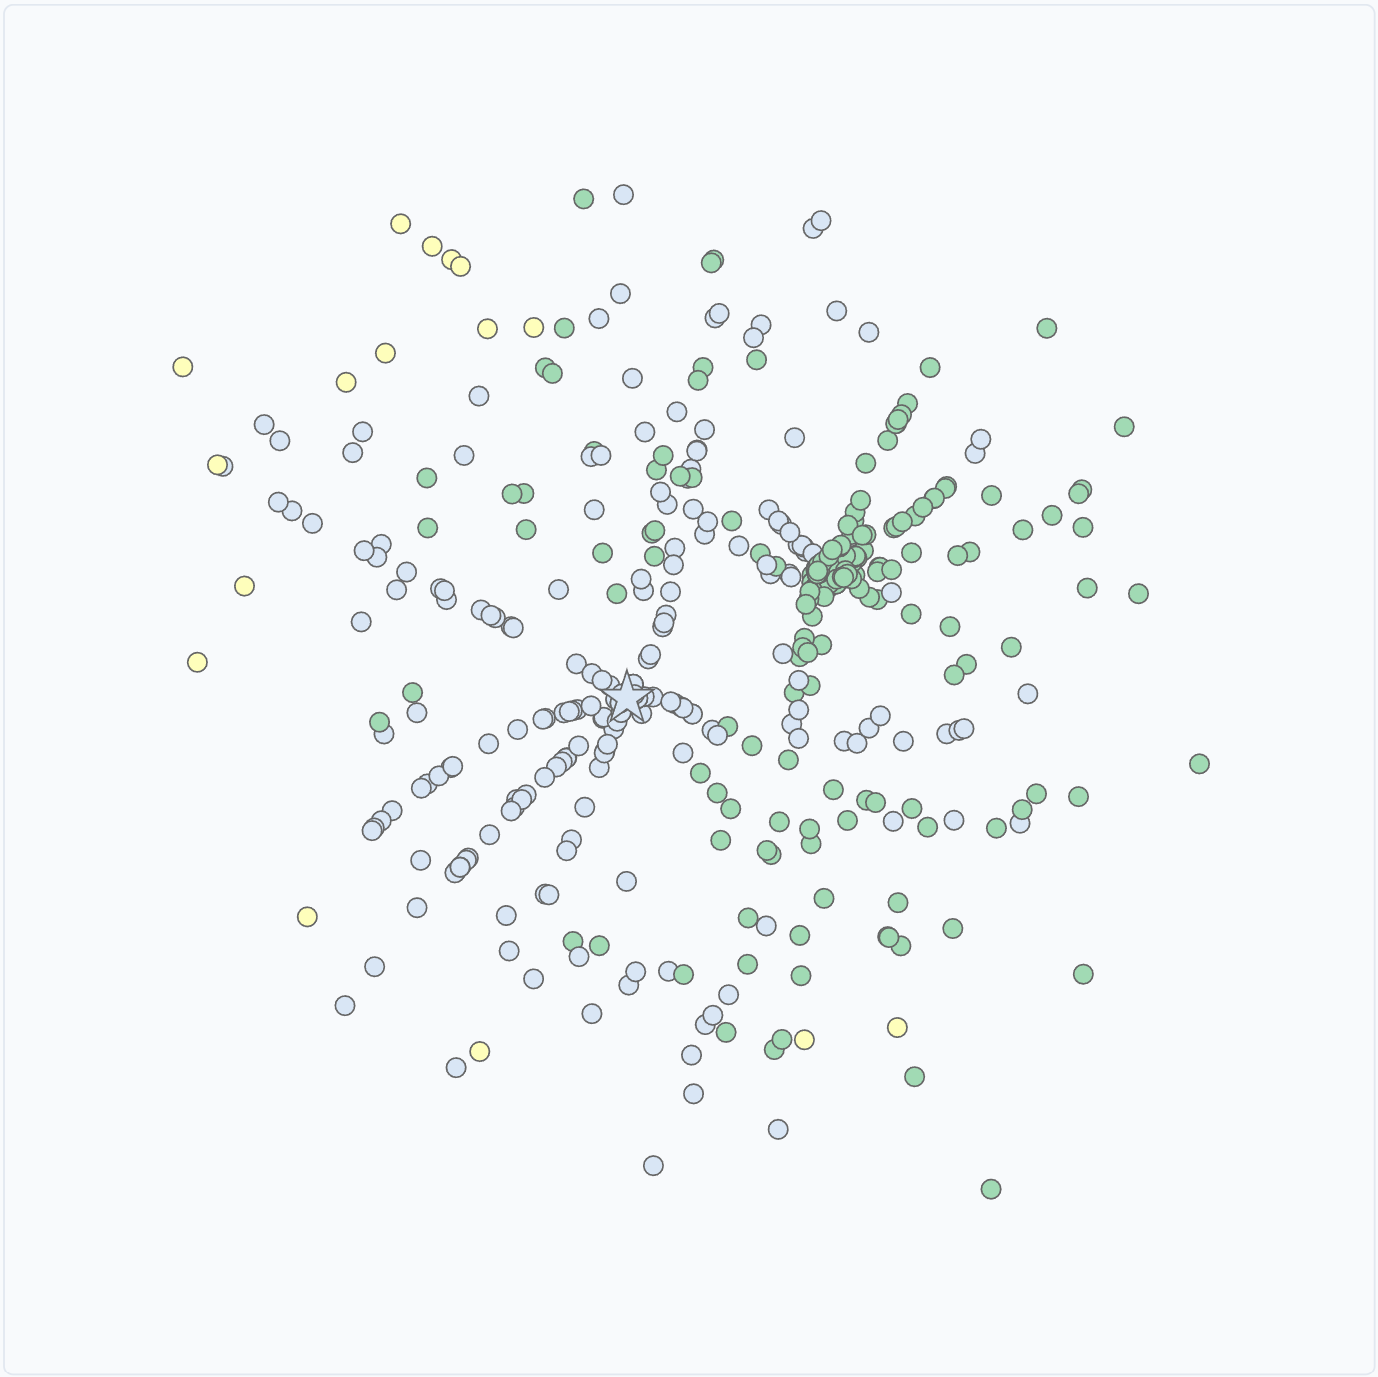
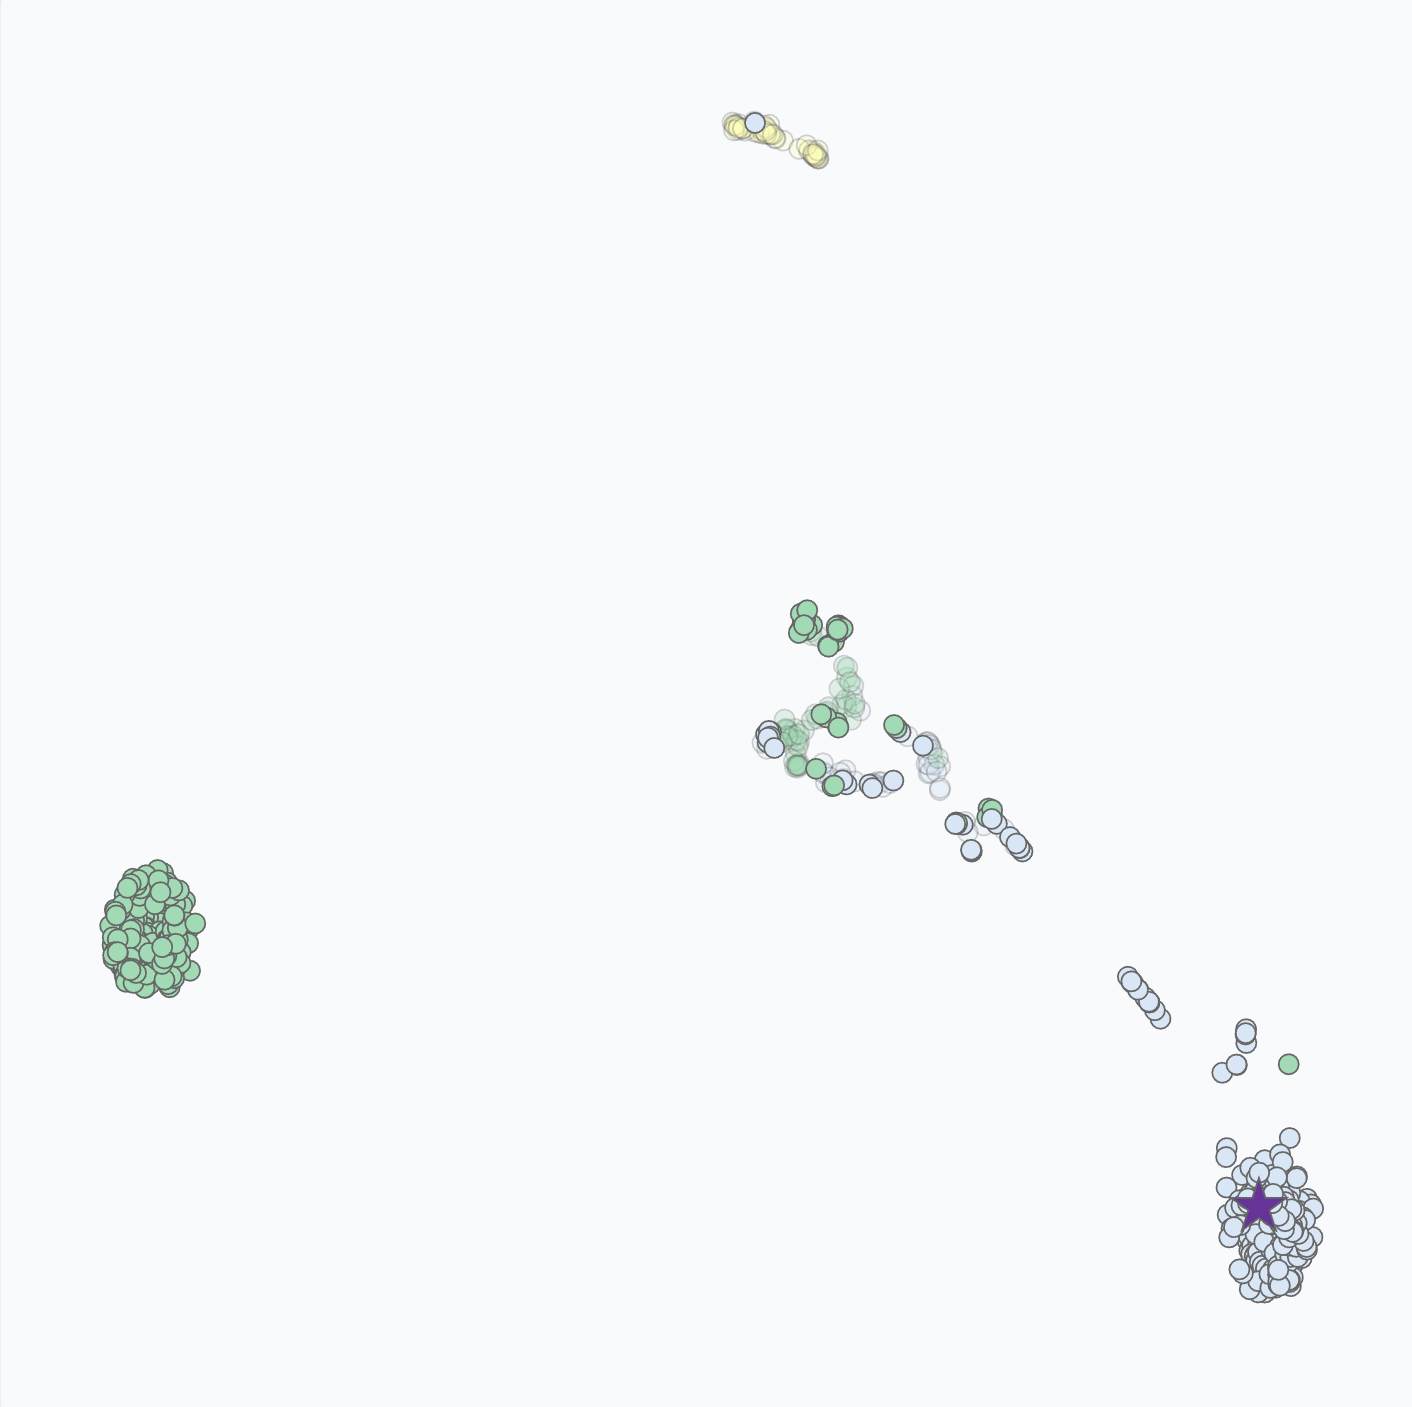
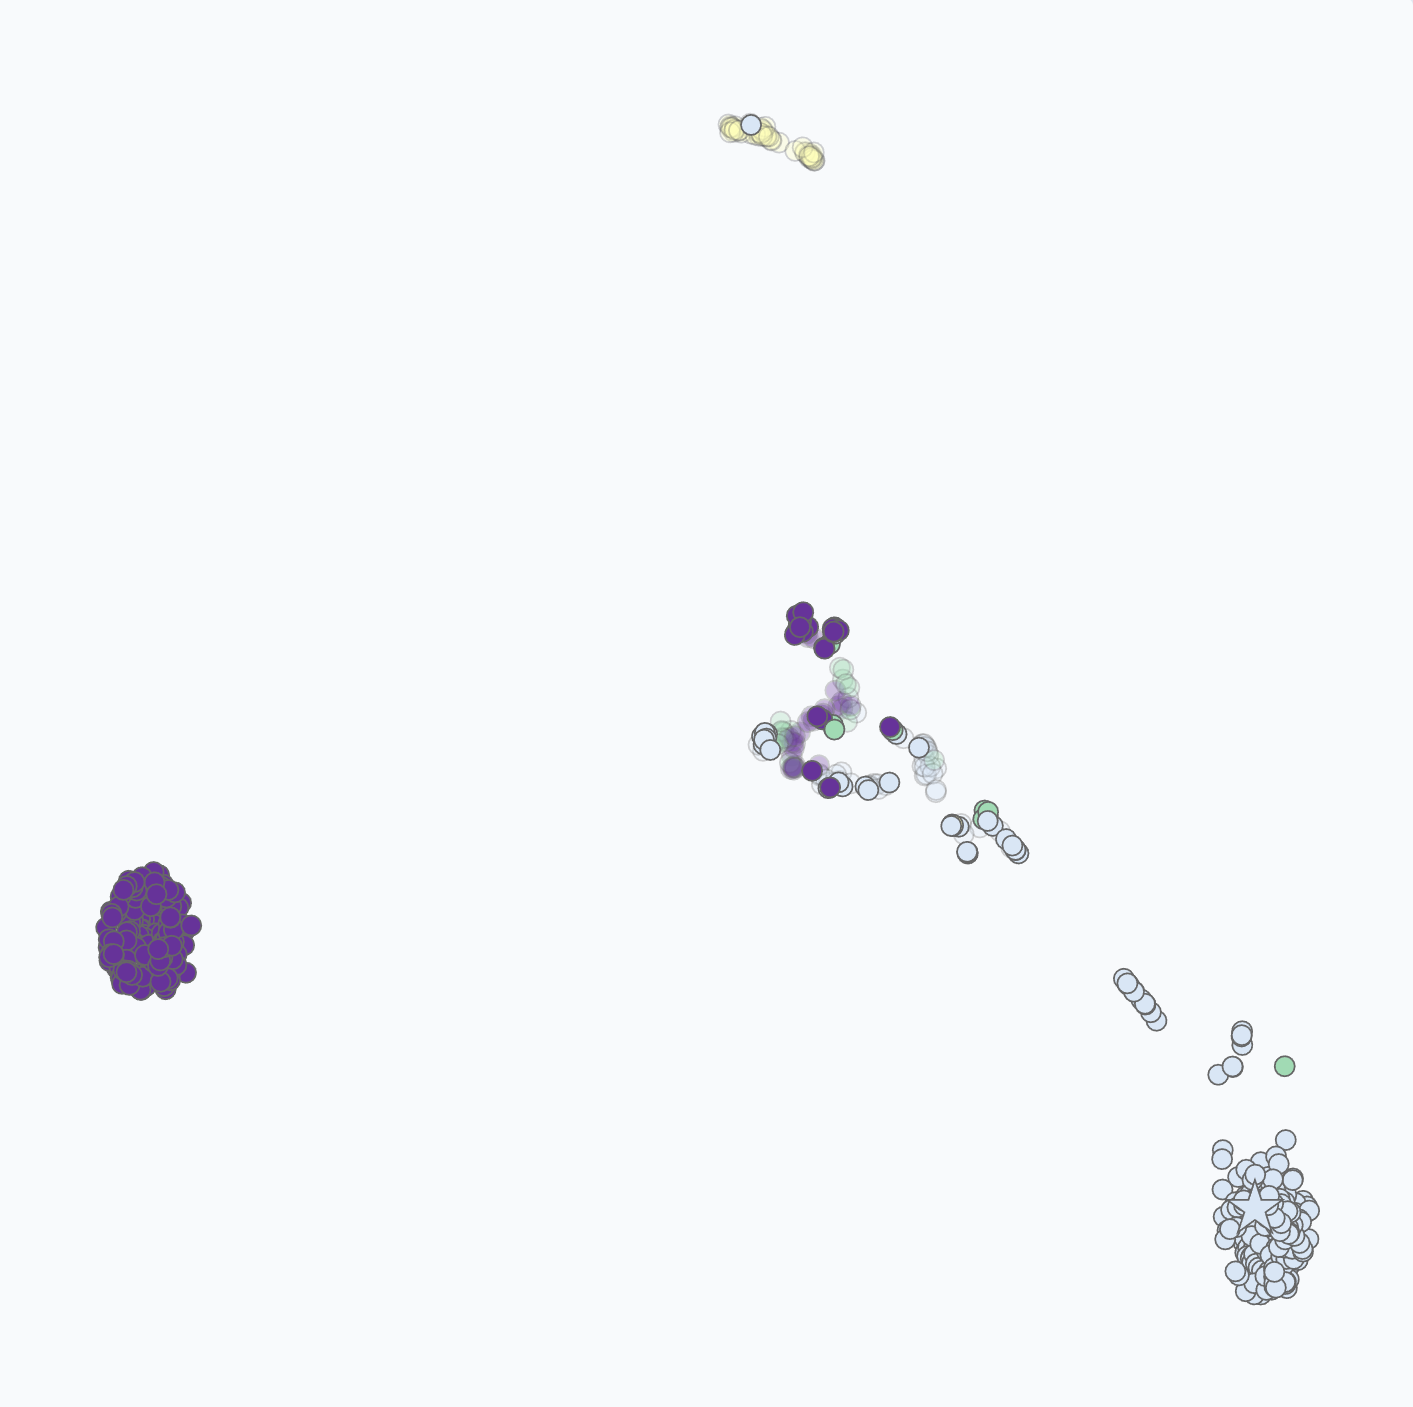
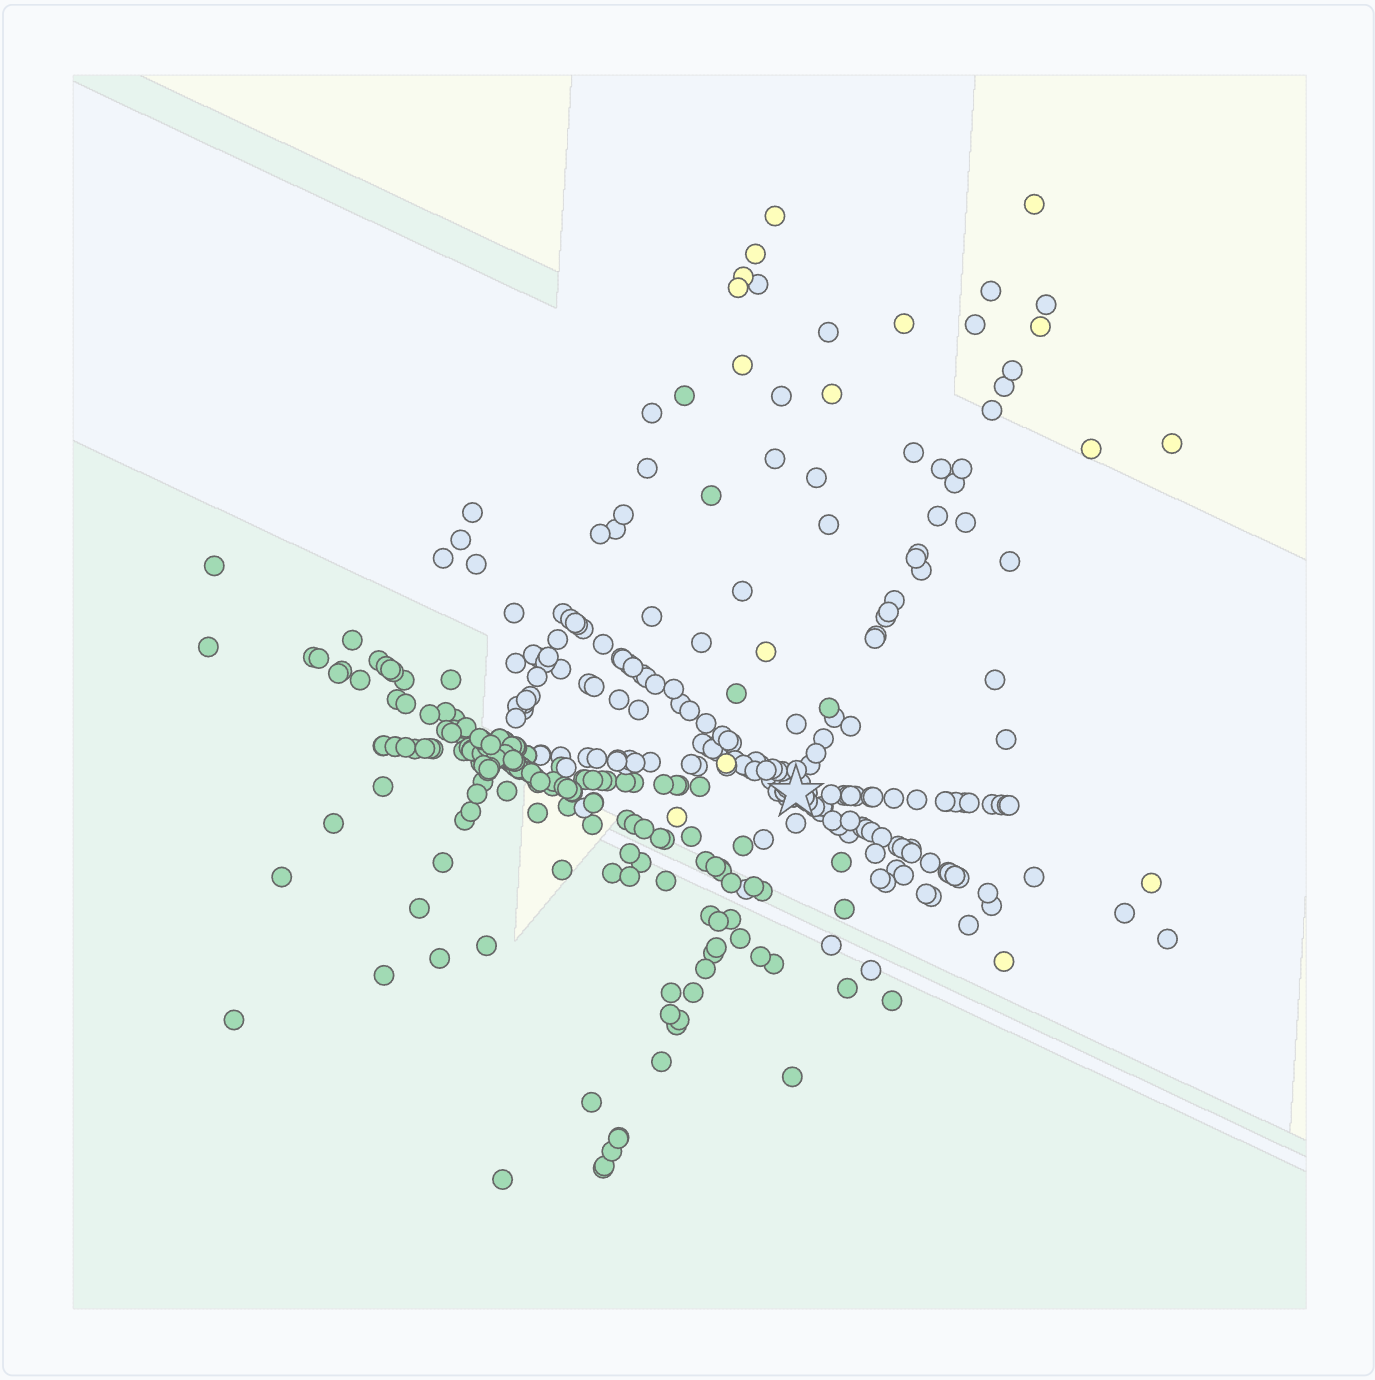
Working with dimensionality reduction techniques deepened my understanding of their trade-offs. I learned that UMAP excels at both local and global structure preservation while maintaining computational efficiency, making it ideal for interactive applications. PCA 's linear transformation preserves decision boundaries, enabling direct visualization of surrogate model regions. Each technique offers distinct advantages for different analytical scenarios.
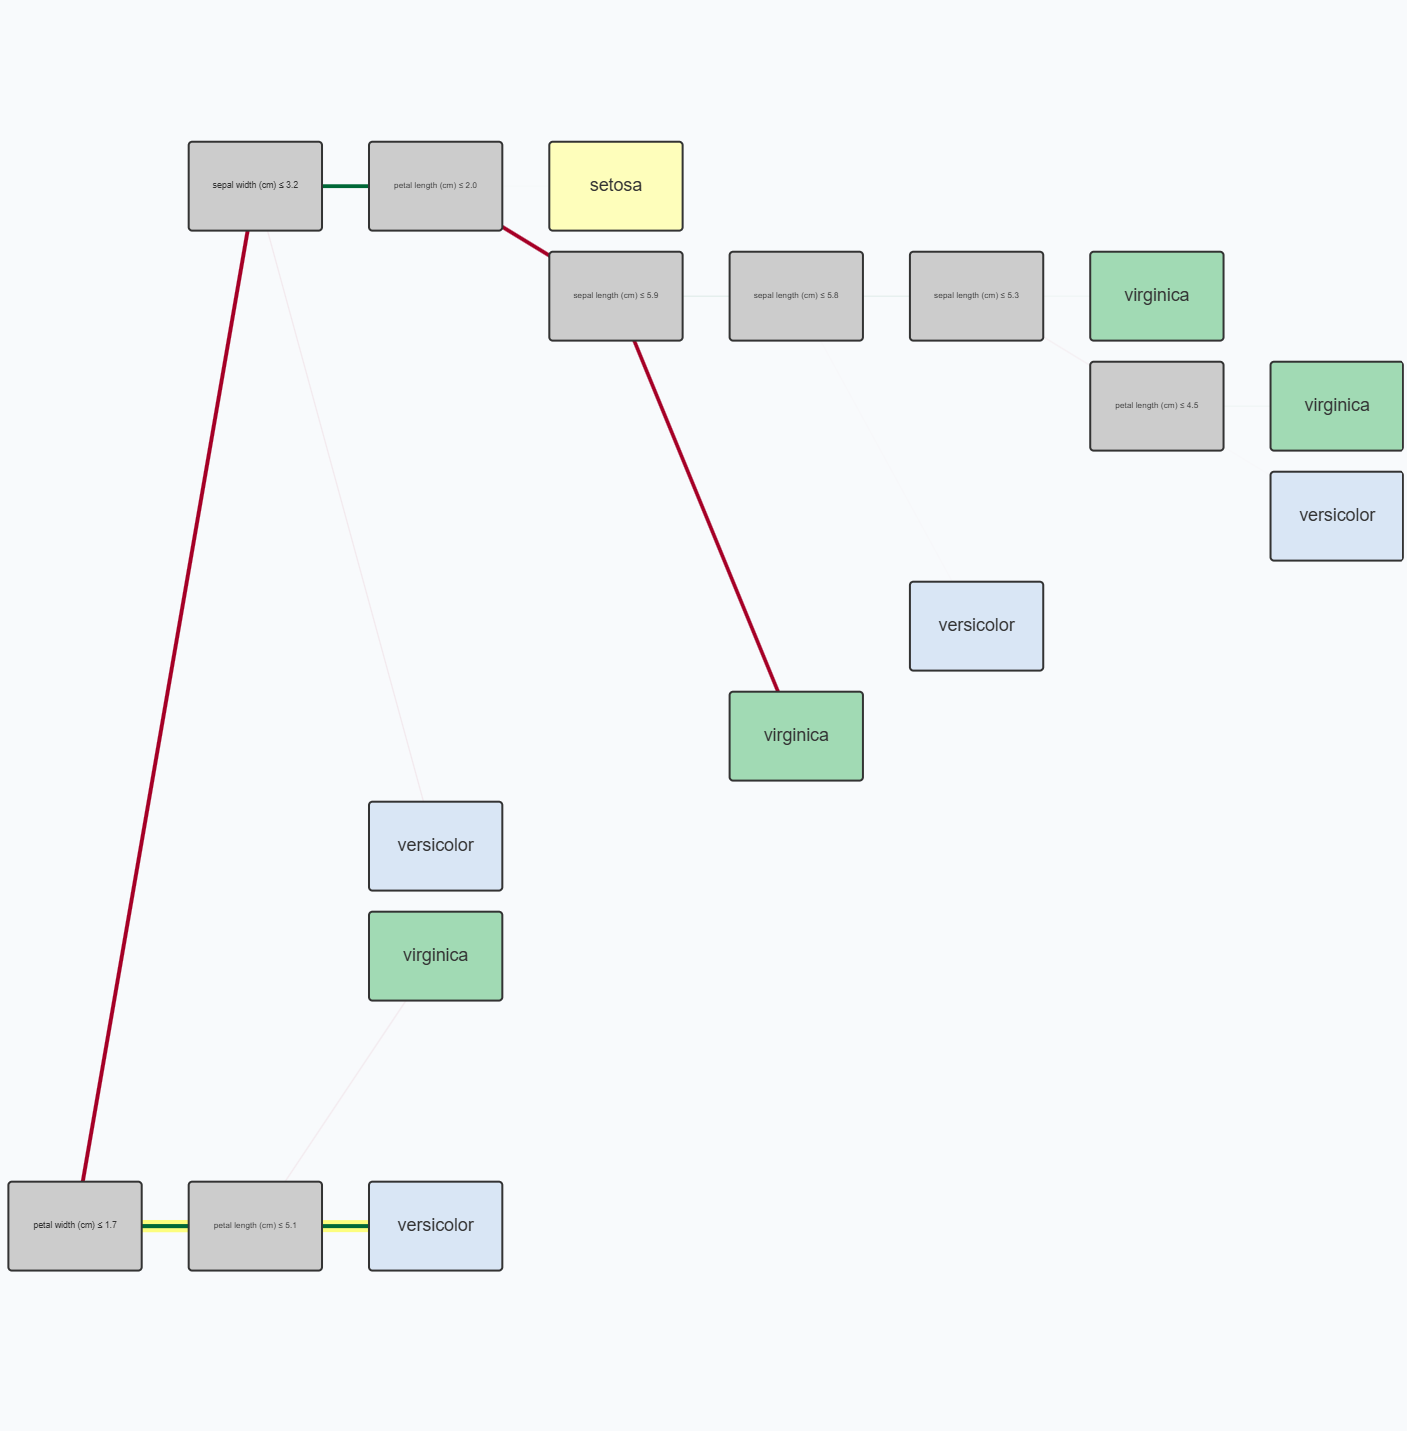
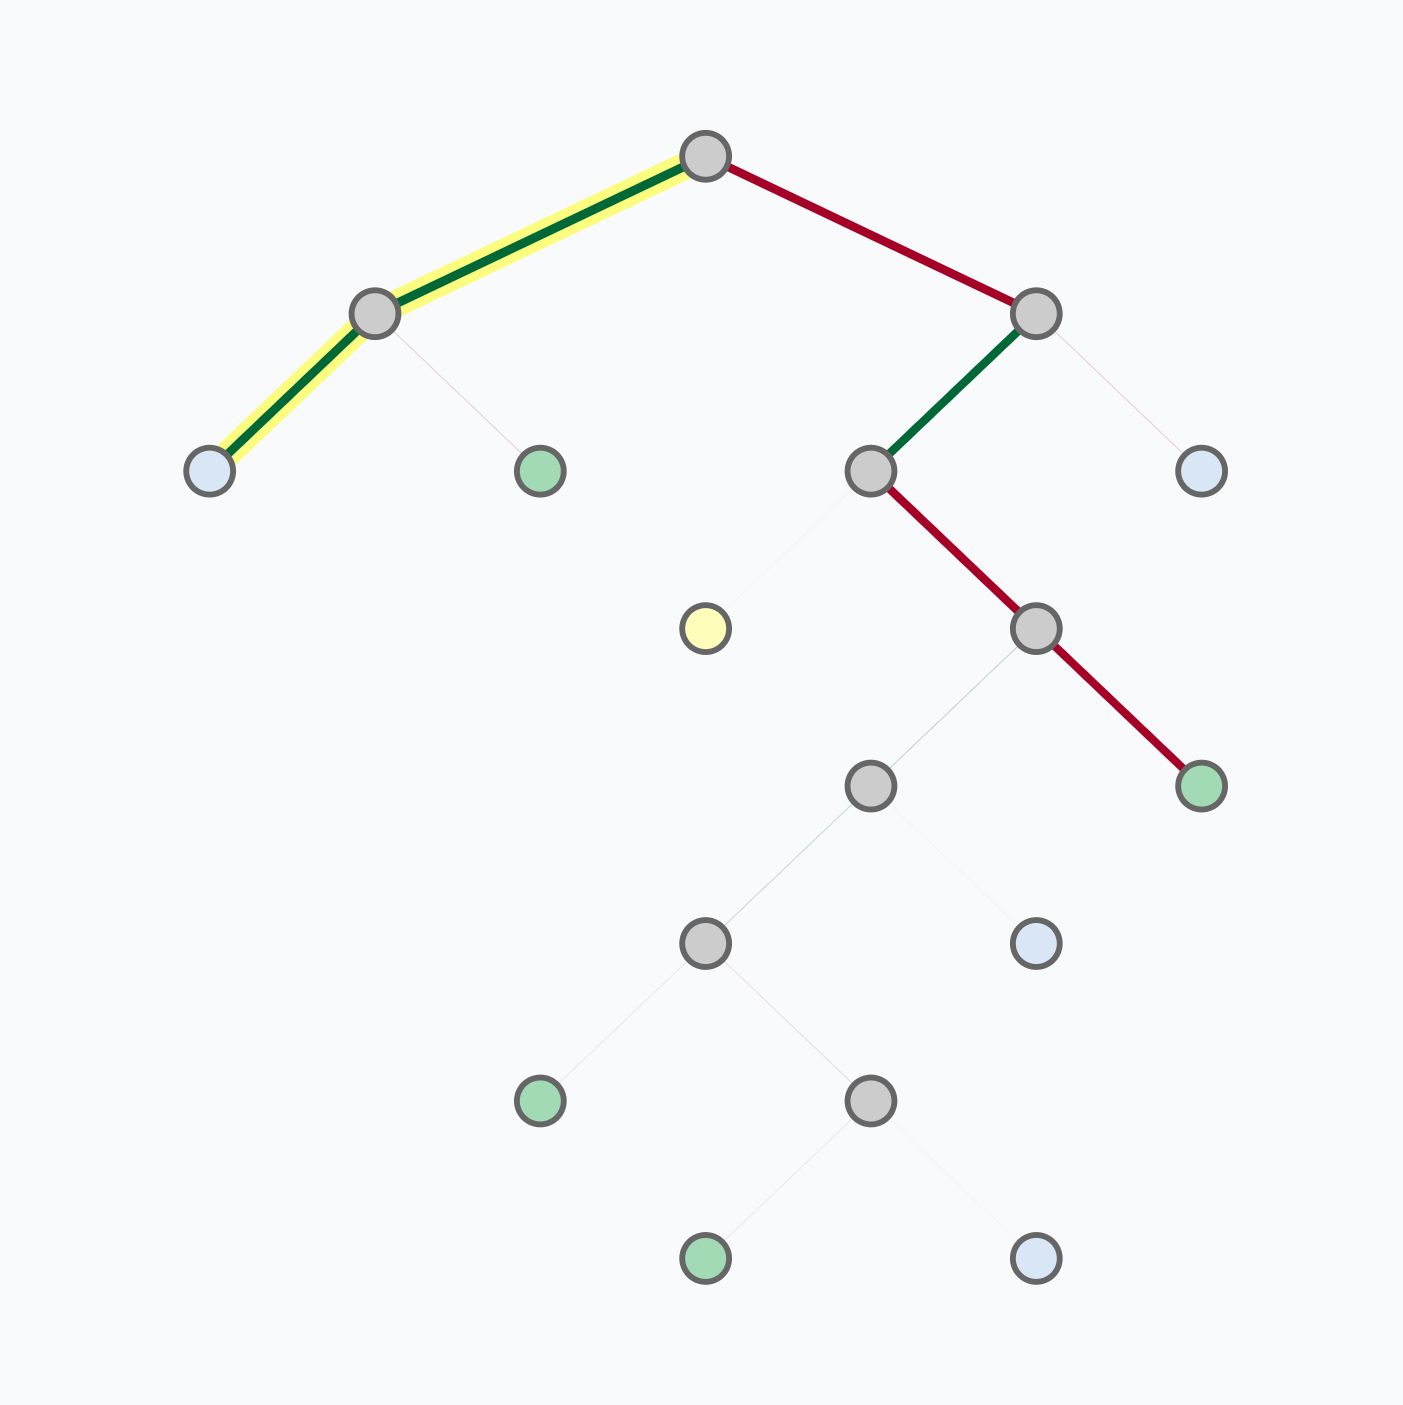
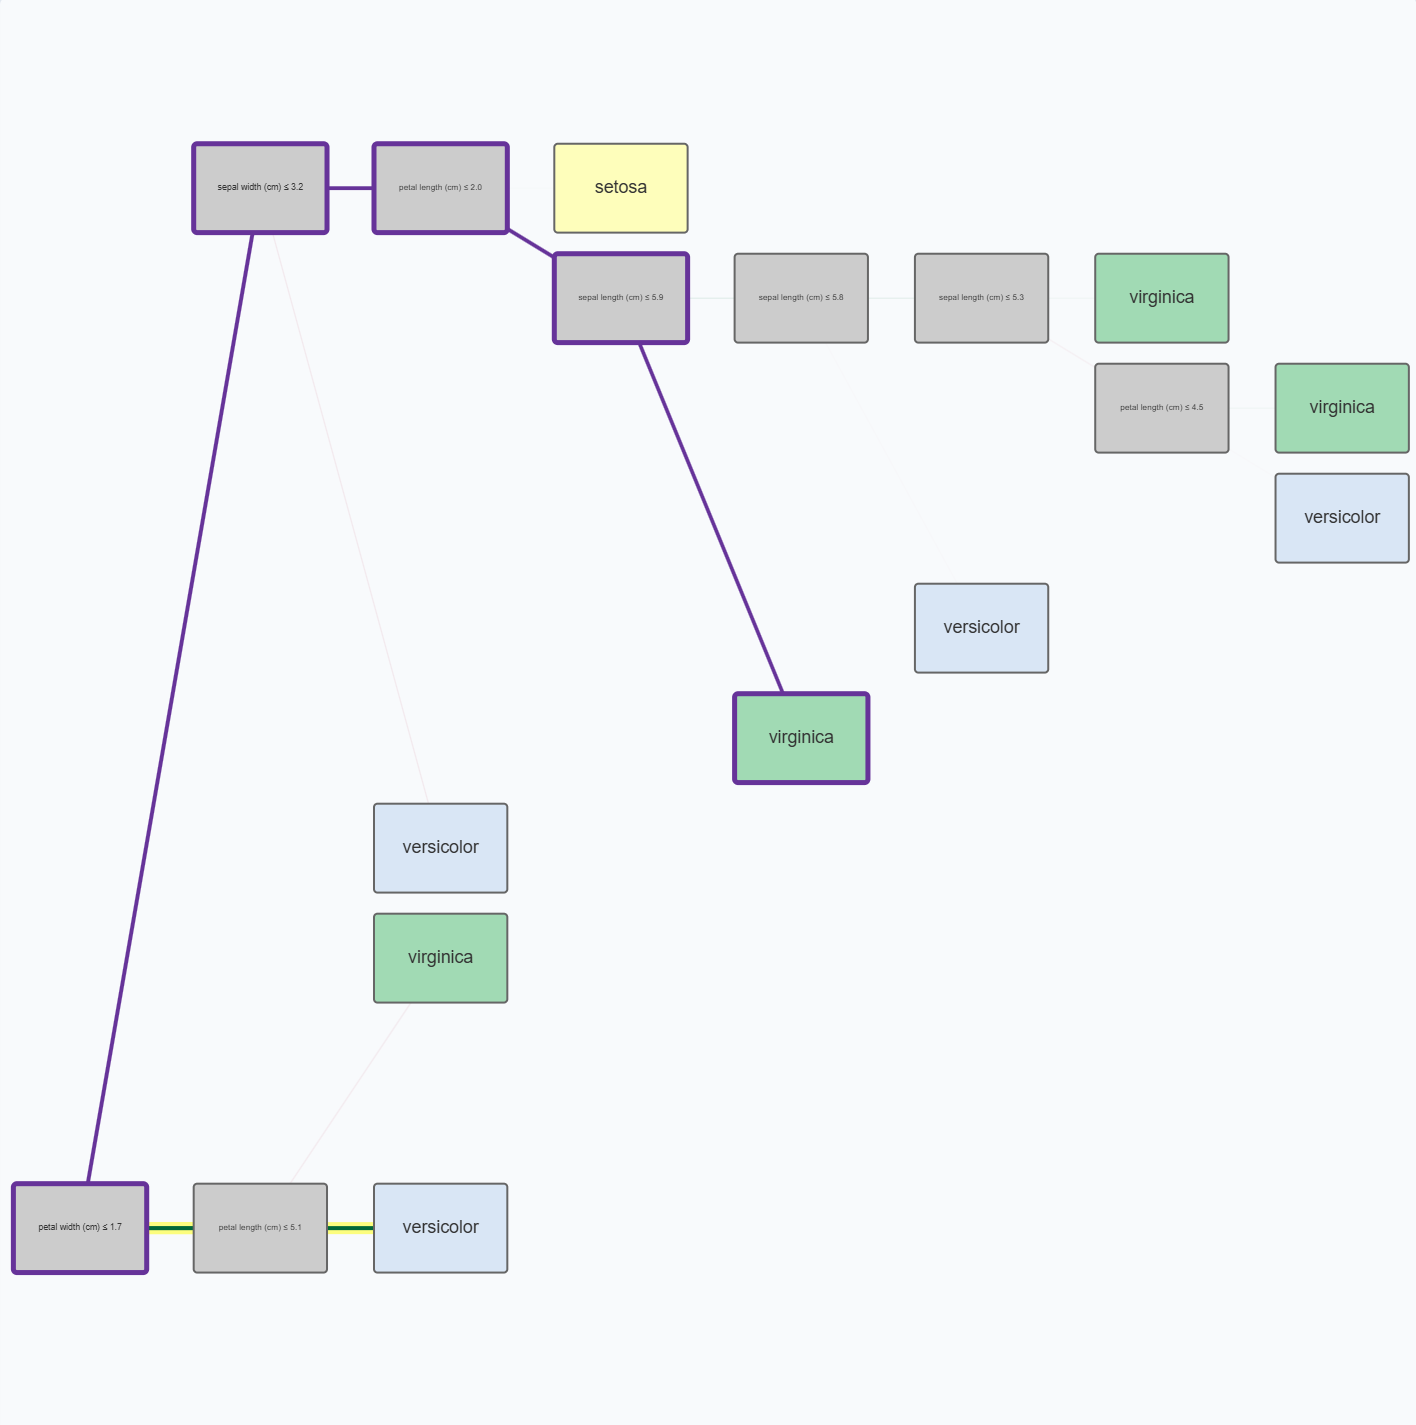
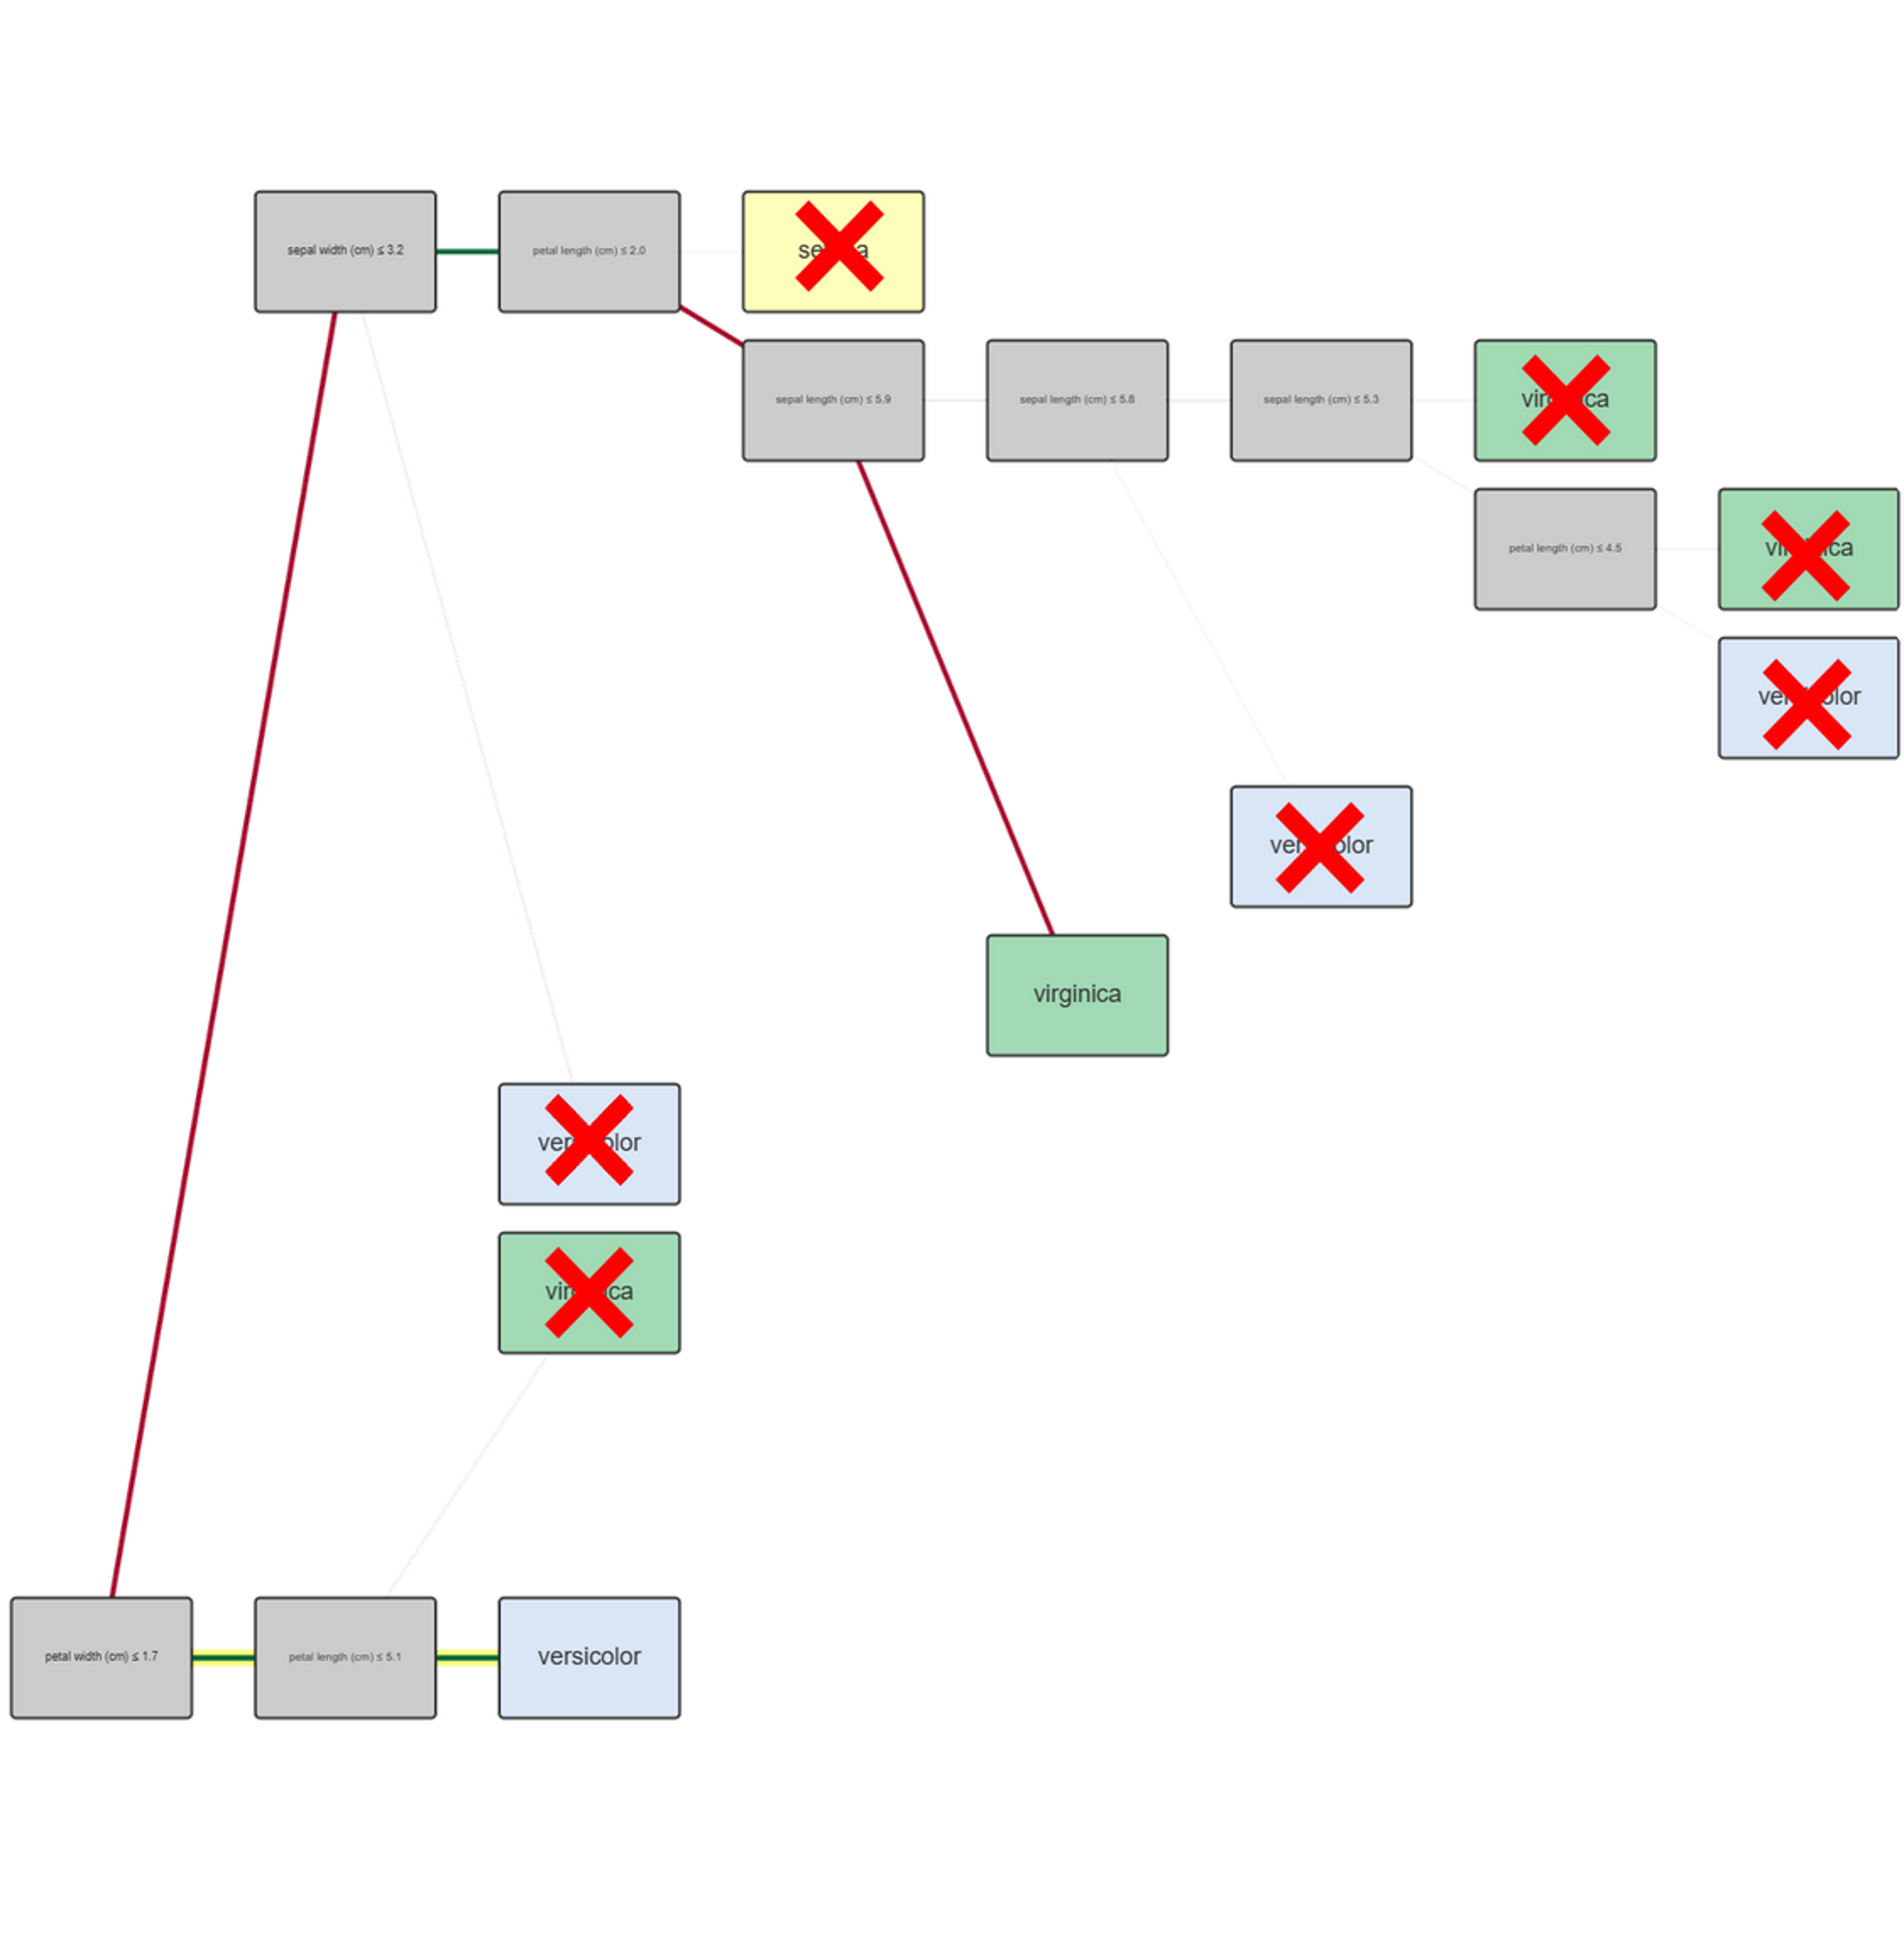
The development of three alternative decision tree visualizations, Tree Layout, Rule and Counterfactual Rules Centered, and Rule Centered, taught me that there is no single "best" visualization approach. Different layouts serve different cognitive approaches and analytical needs.
The Voronoi tessellation implementation for decision boundary visualization taught me sophisticated geometric algorithms and their application to machine learning visualization. Balancing computational efficiency with visual accuracy through user-configurable granularity settings demonstrated the importance of providing users control over performance-quality trade-offs.
Perhaps most importantly, I learned that effective XAI tools must address cognitive load through visual connection mechanisms, enable confirmation through interactive exploration, and support diverse mental models through multiple representation formats. The documented use cases validated that well-designed coordination mechanisms transform explanation consumption from passive acceptance into active analytical investigation.