I have developed a digital toolkit for urban research and analysis in my hometown, Bari. The project is part of a collaborative article examining aggregation spaces and urban dynamics, this project contains two sophisticated web-based visualization tools designed to transform survey data and geographic information into publication-ready outputs. The tools were developed for Scomodo , a cultural association focused on independent journalism and social analysis.
The project addresses a critical need in urban research: the ability to visualize and communicate complex data about community spaces, amenities, and resident perspectives in an accessible yet rigorous manner. By combining interactive data visualization with cartographic mapping, the toolkit enables researchers, journalists, and community organizers to explore patterns in urban life, identify spatial relationships, and produce high-quality visual materials for both digital and print publications.
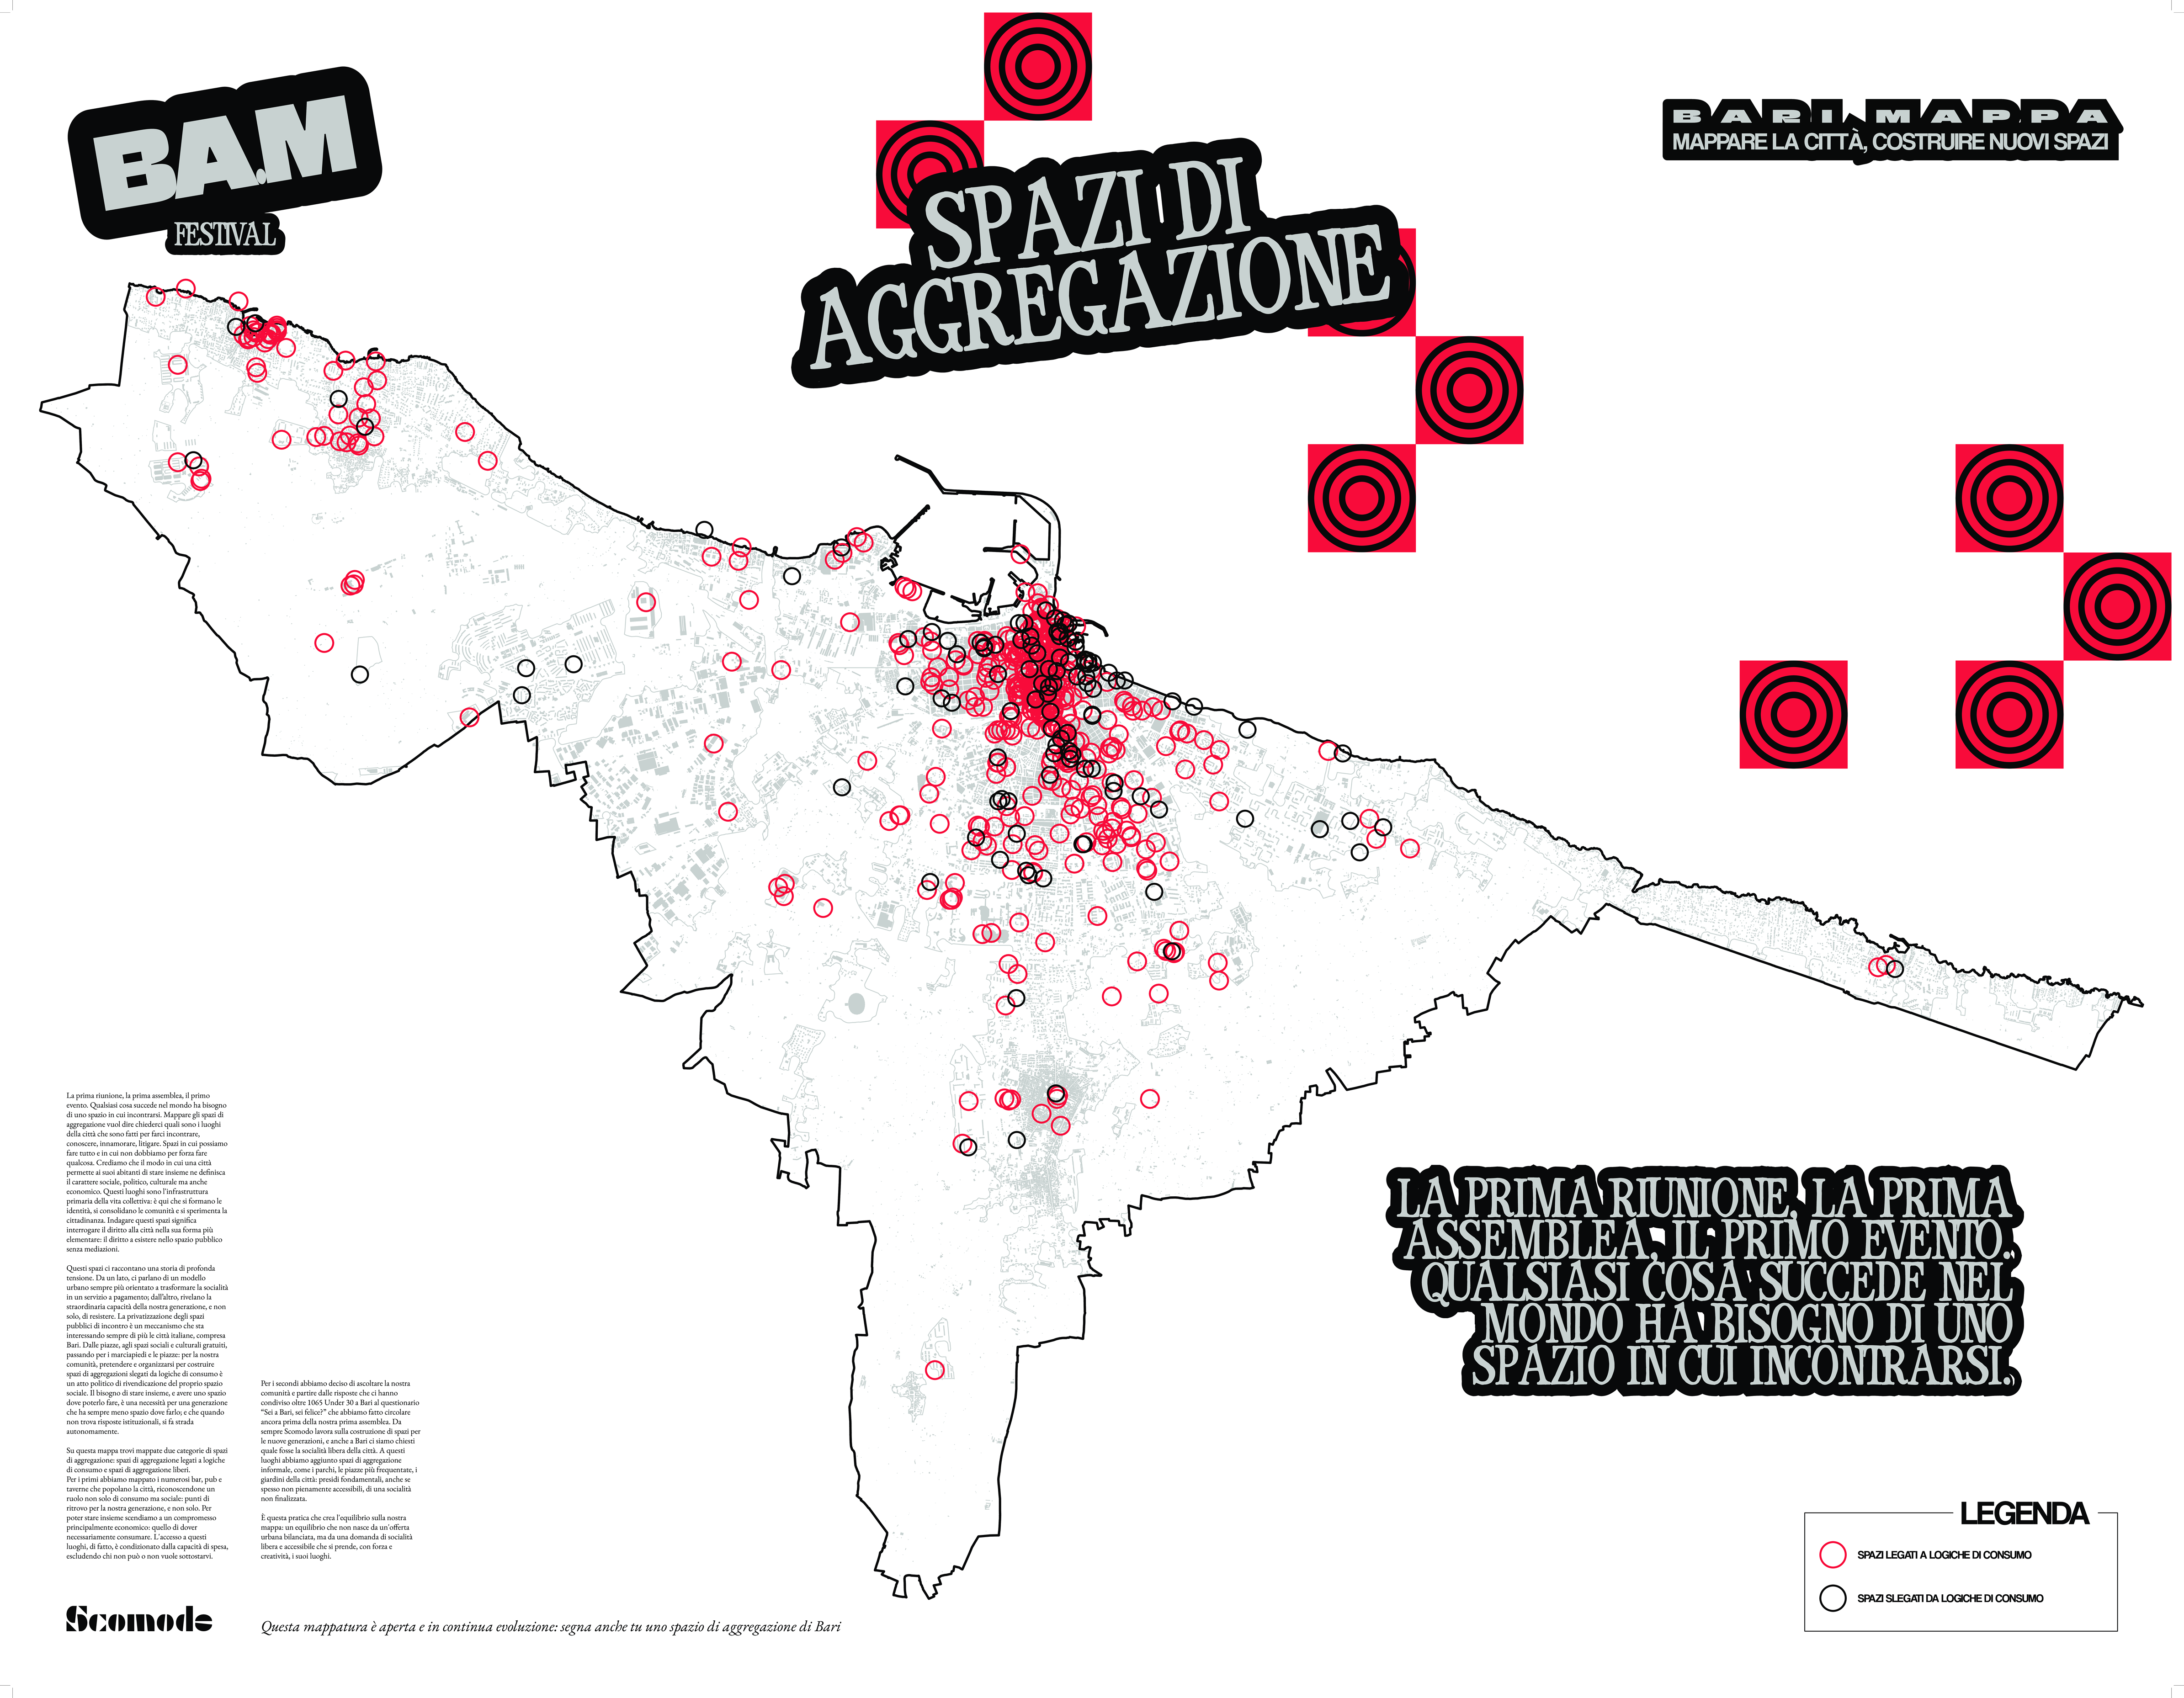
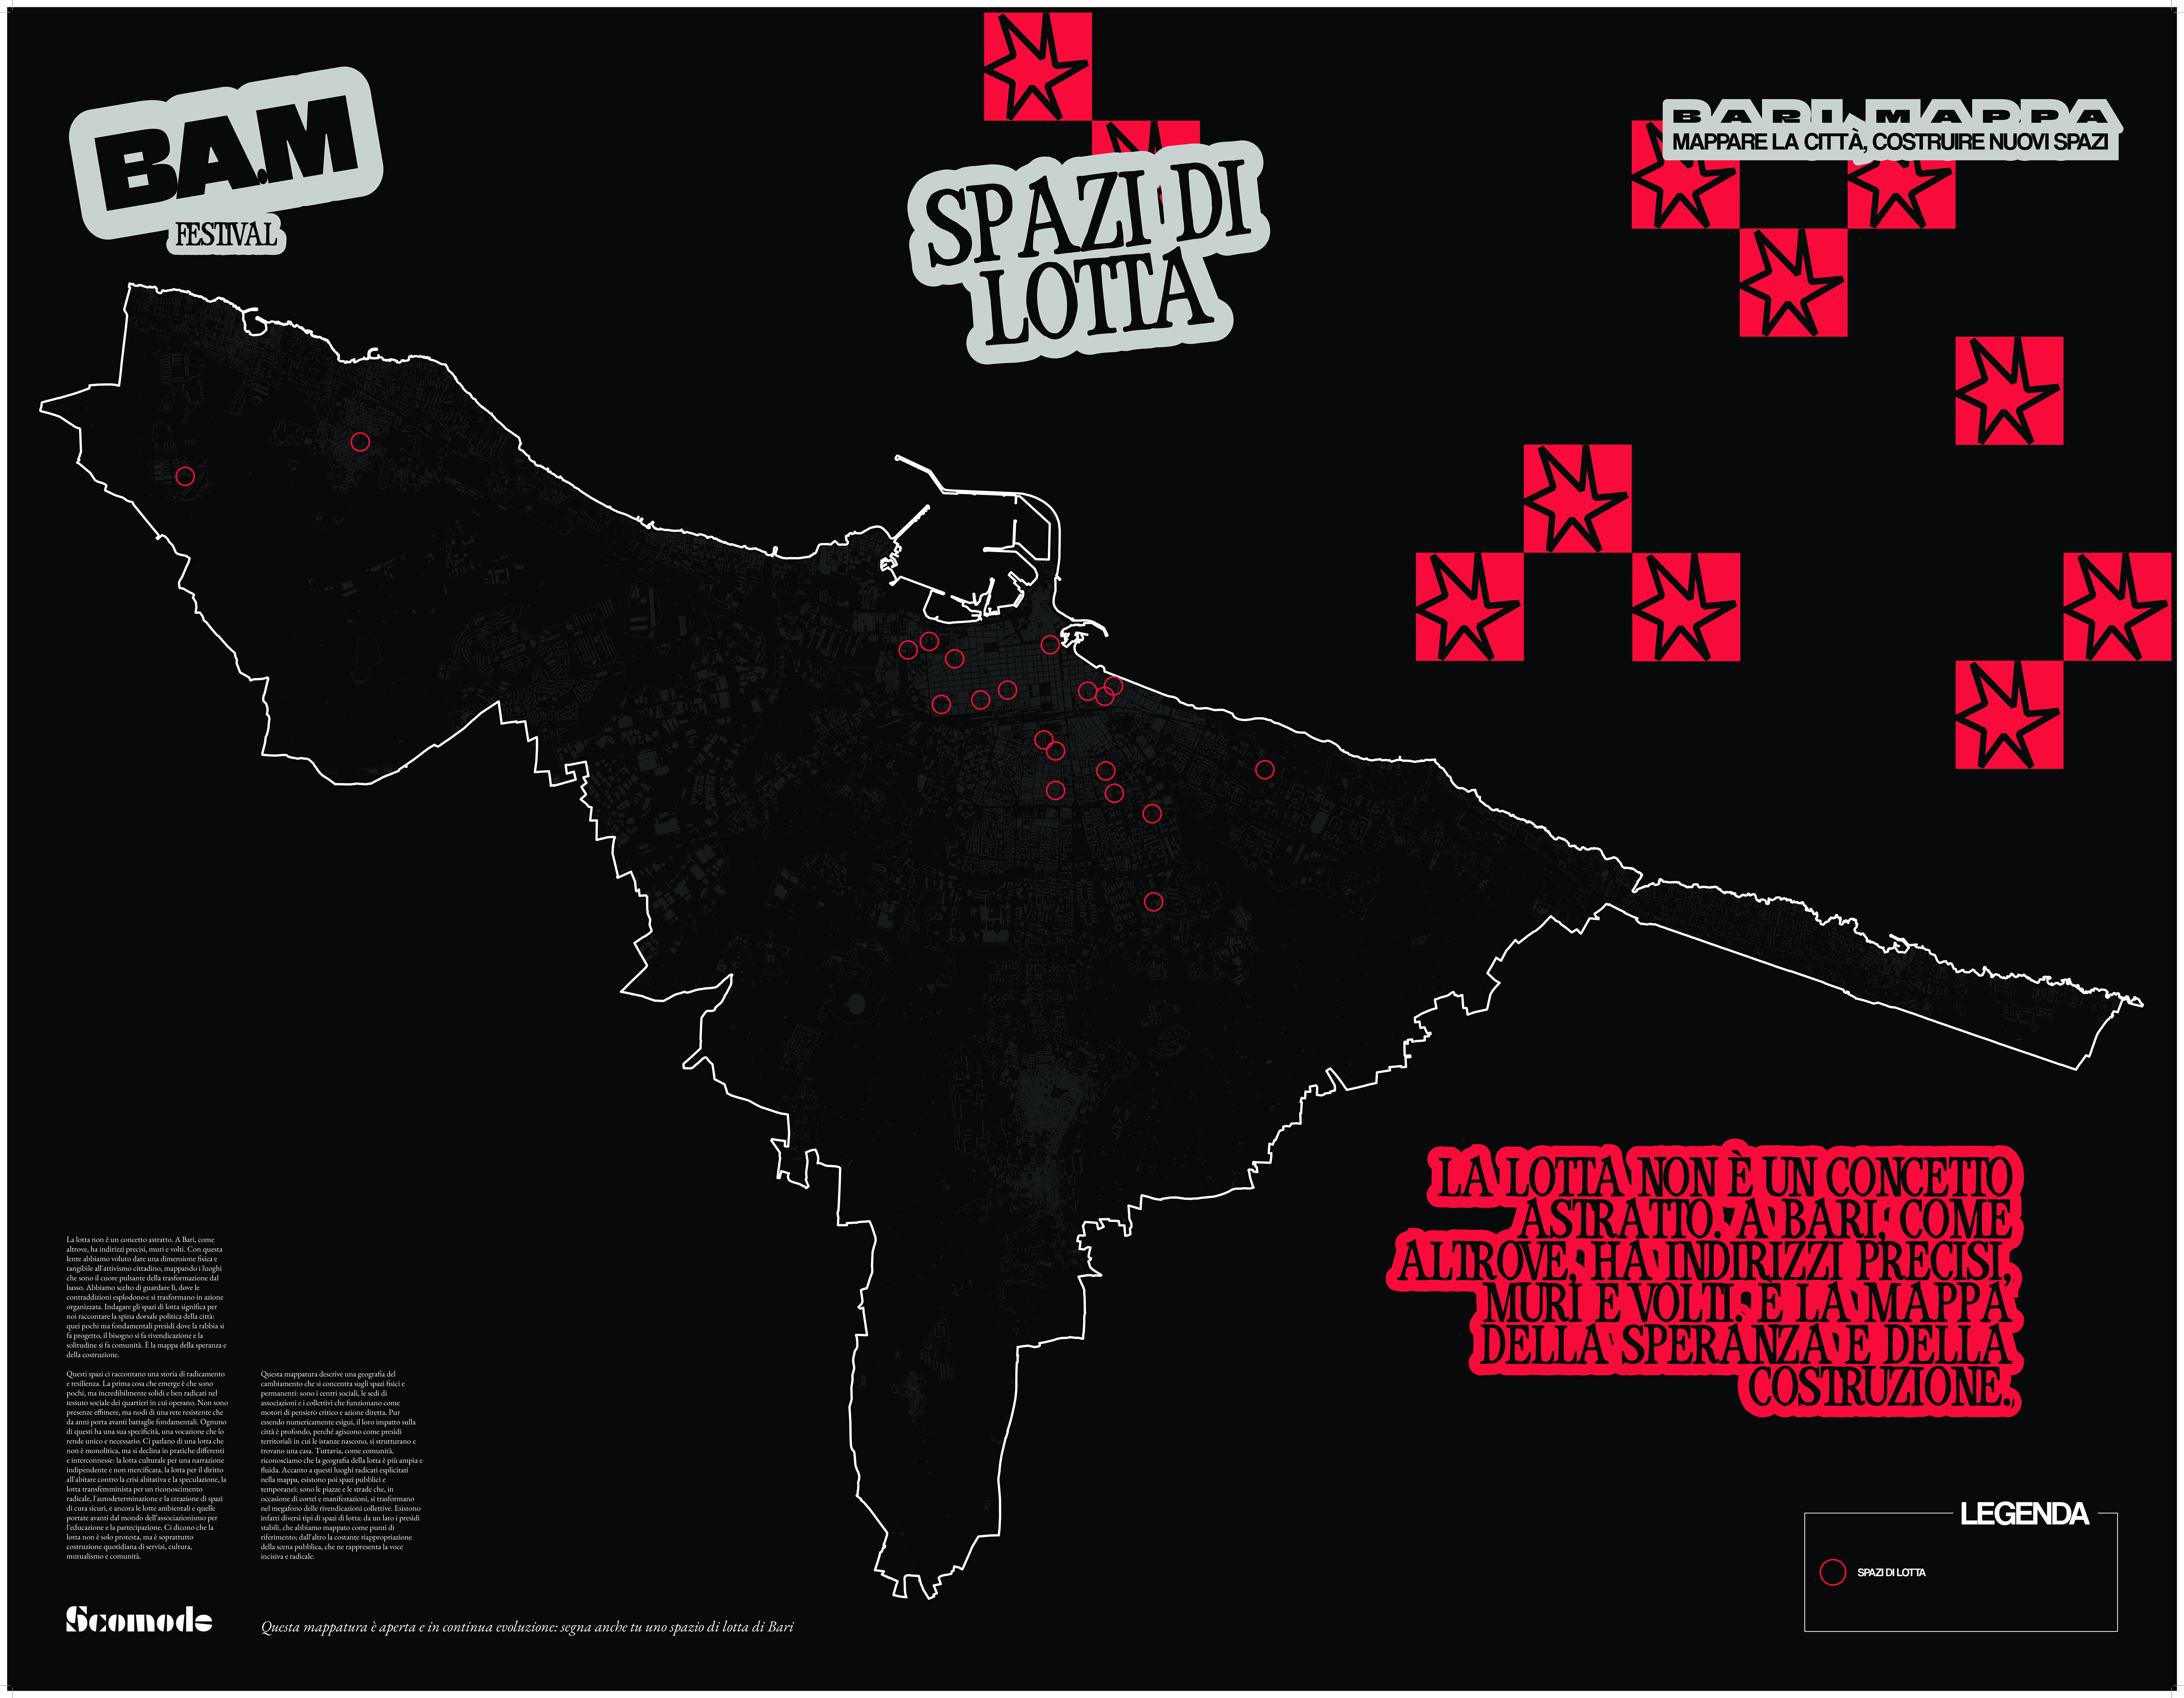
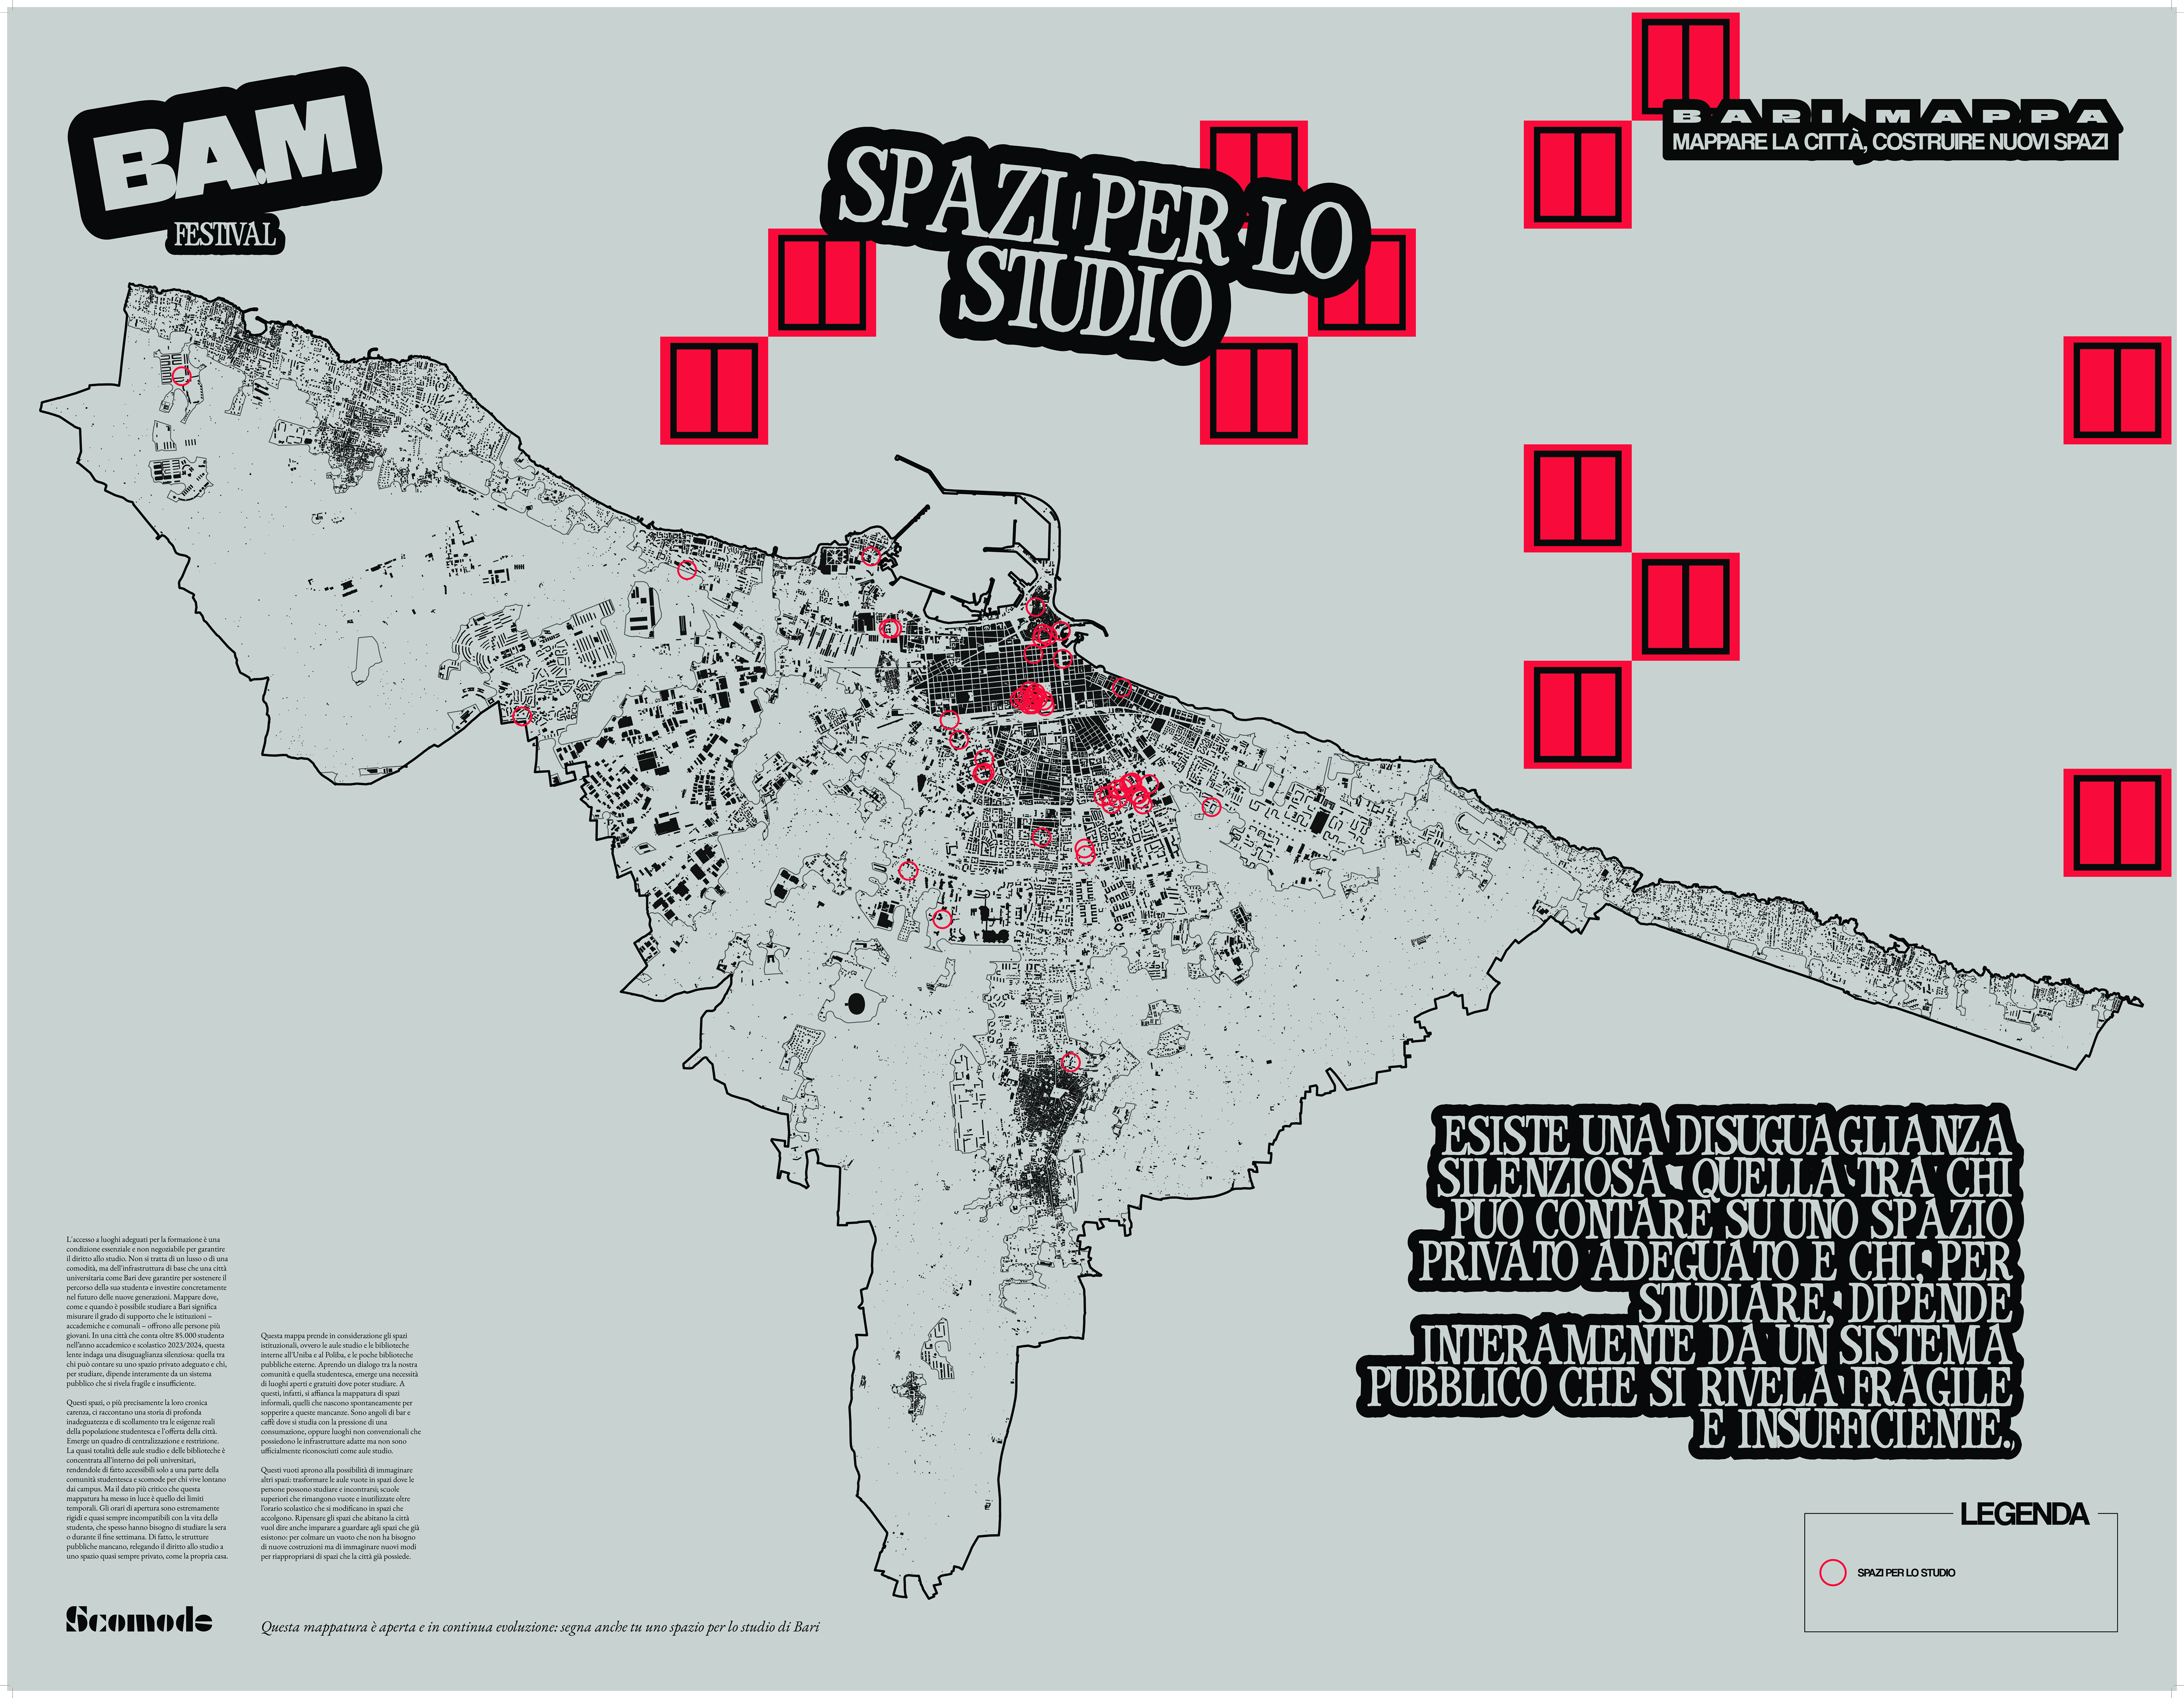
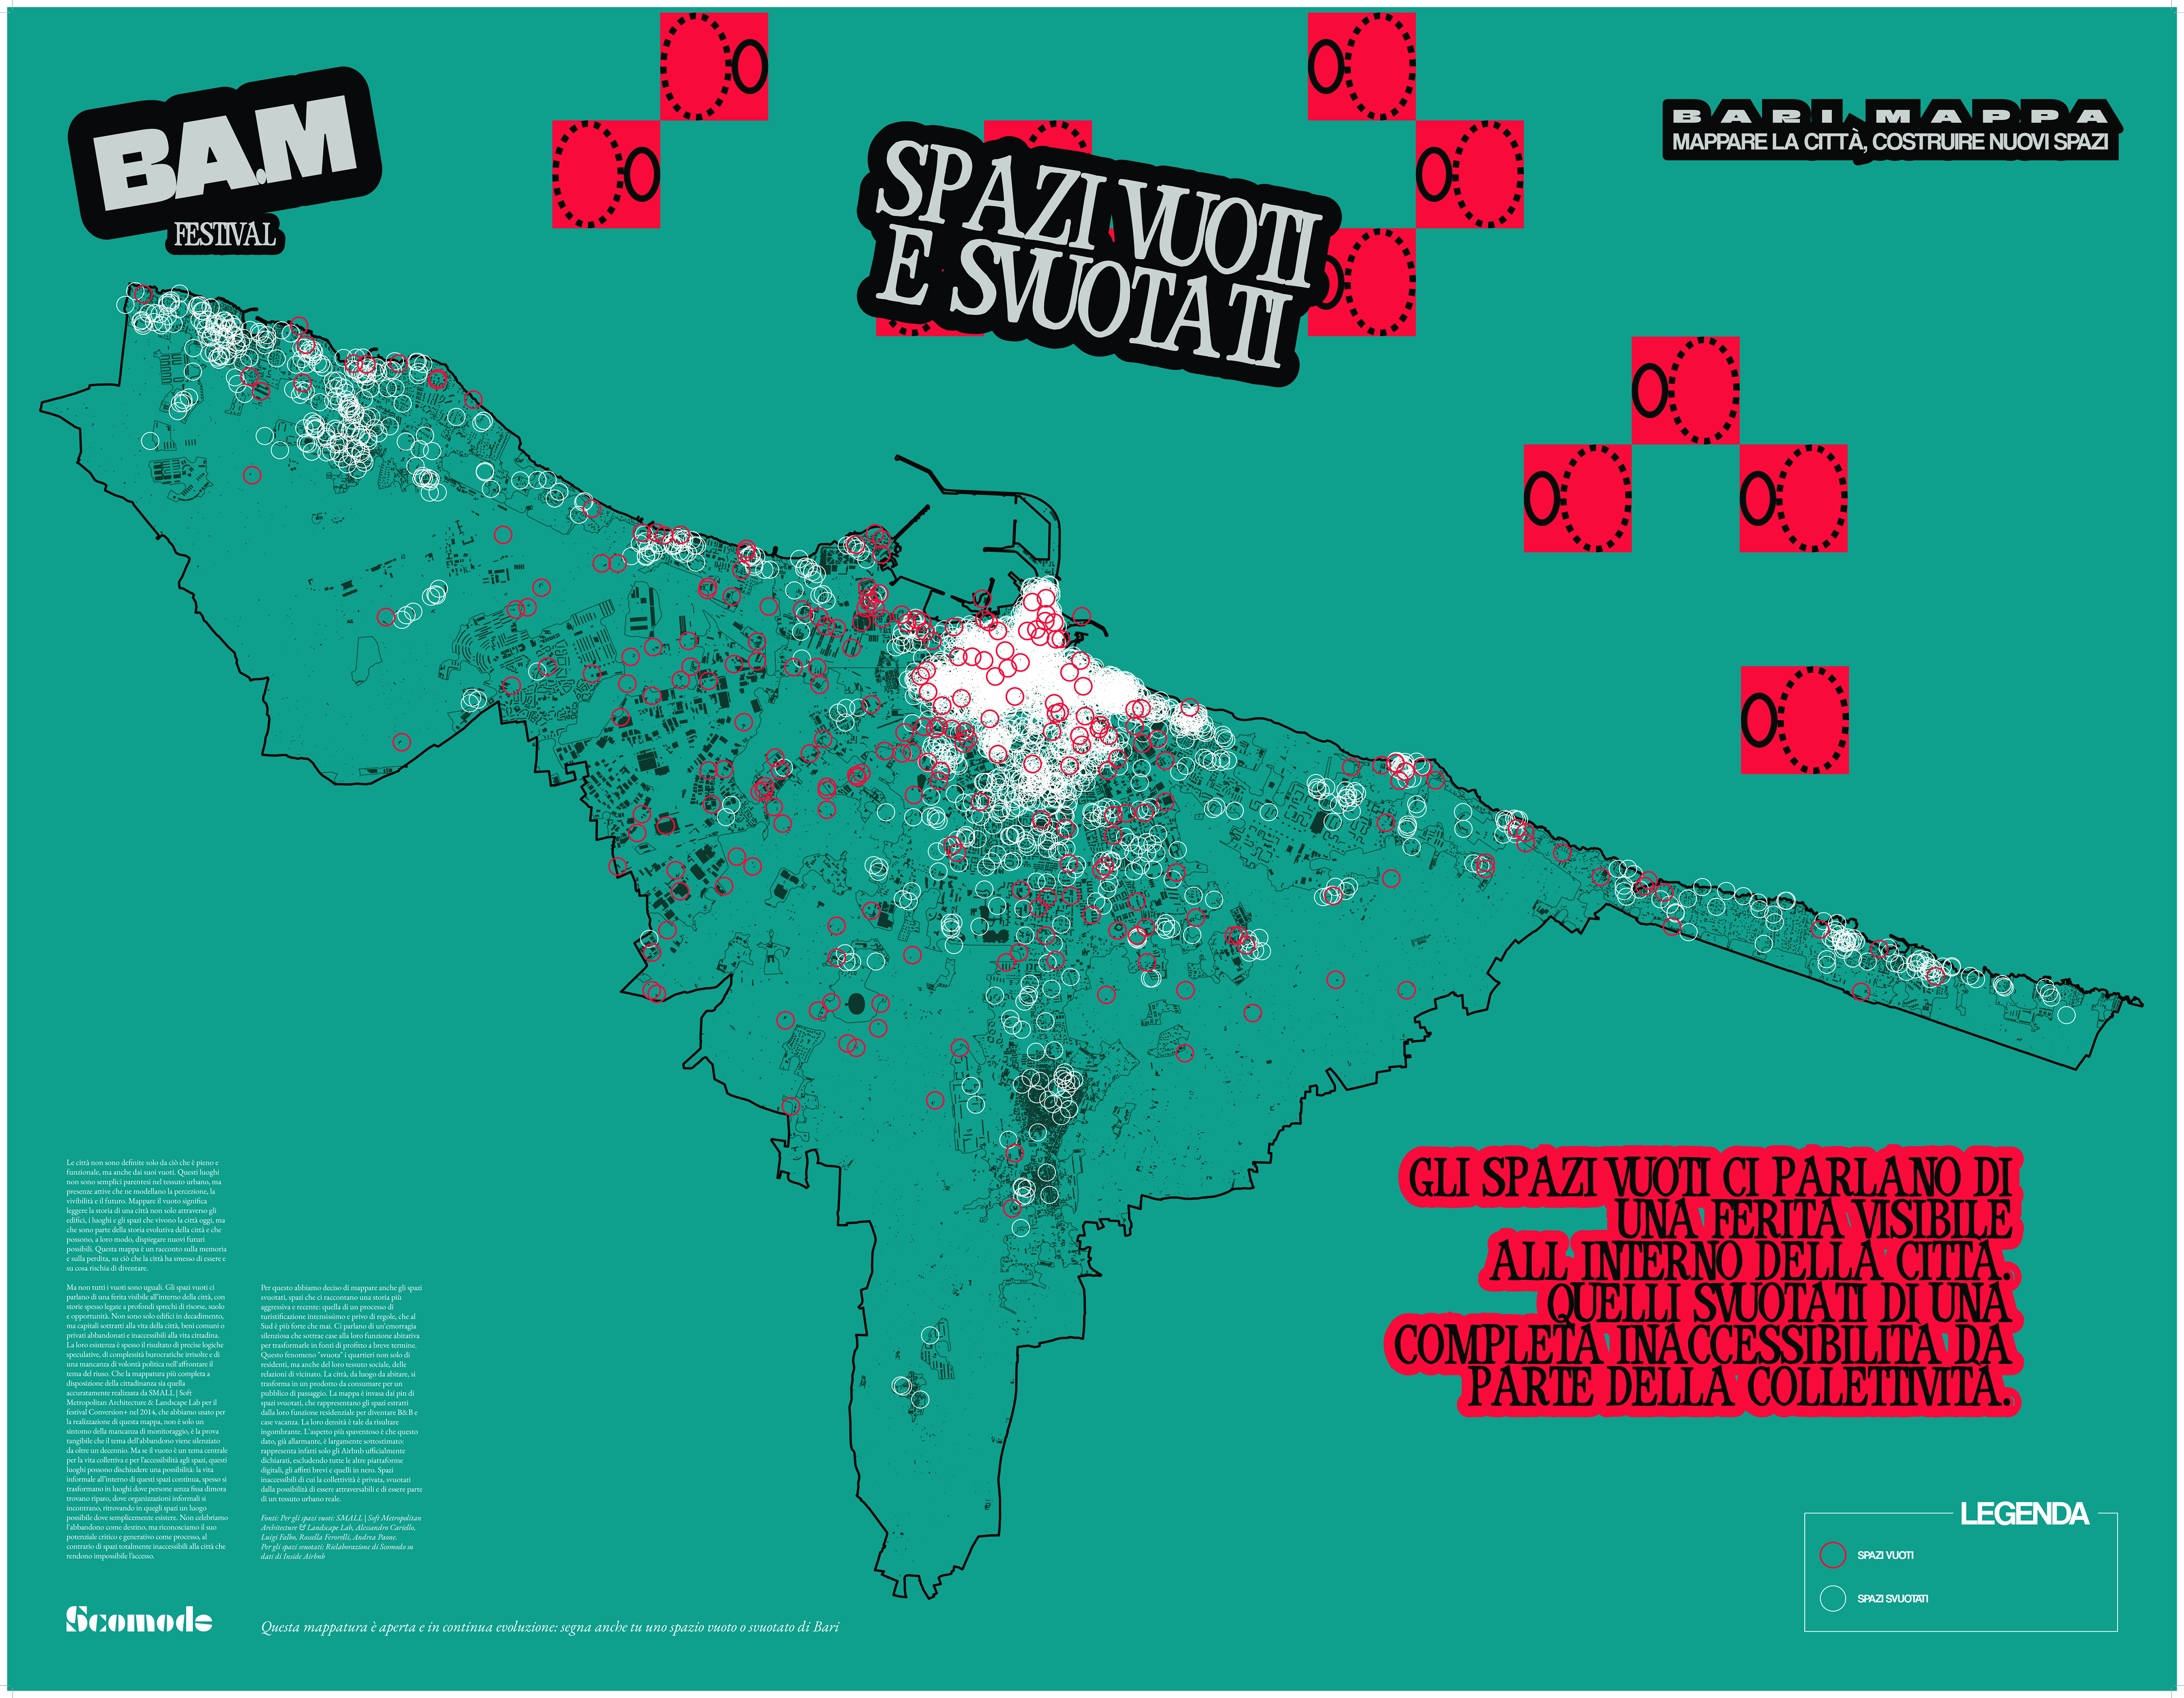
The project consists of two tools: an interactive survey visualization dashboard that transforms some of this questionnaire responses into dynamic charts and graphs, and a cartographic mapping tool that creates publication-ready SVG maps displaying various urban features and amenities.
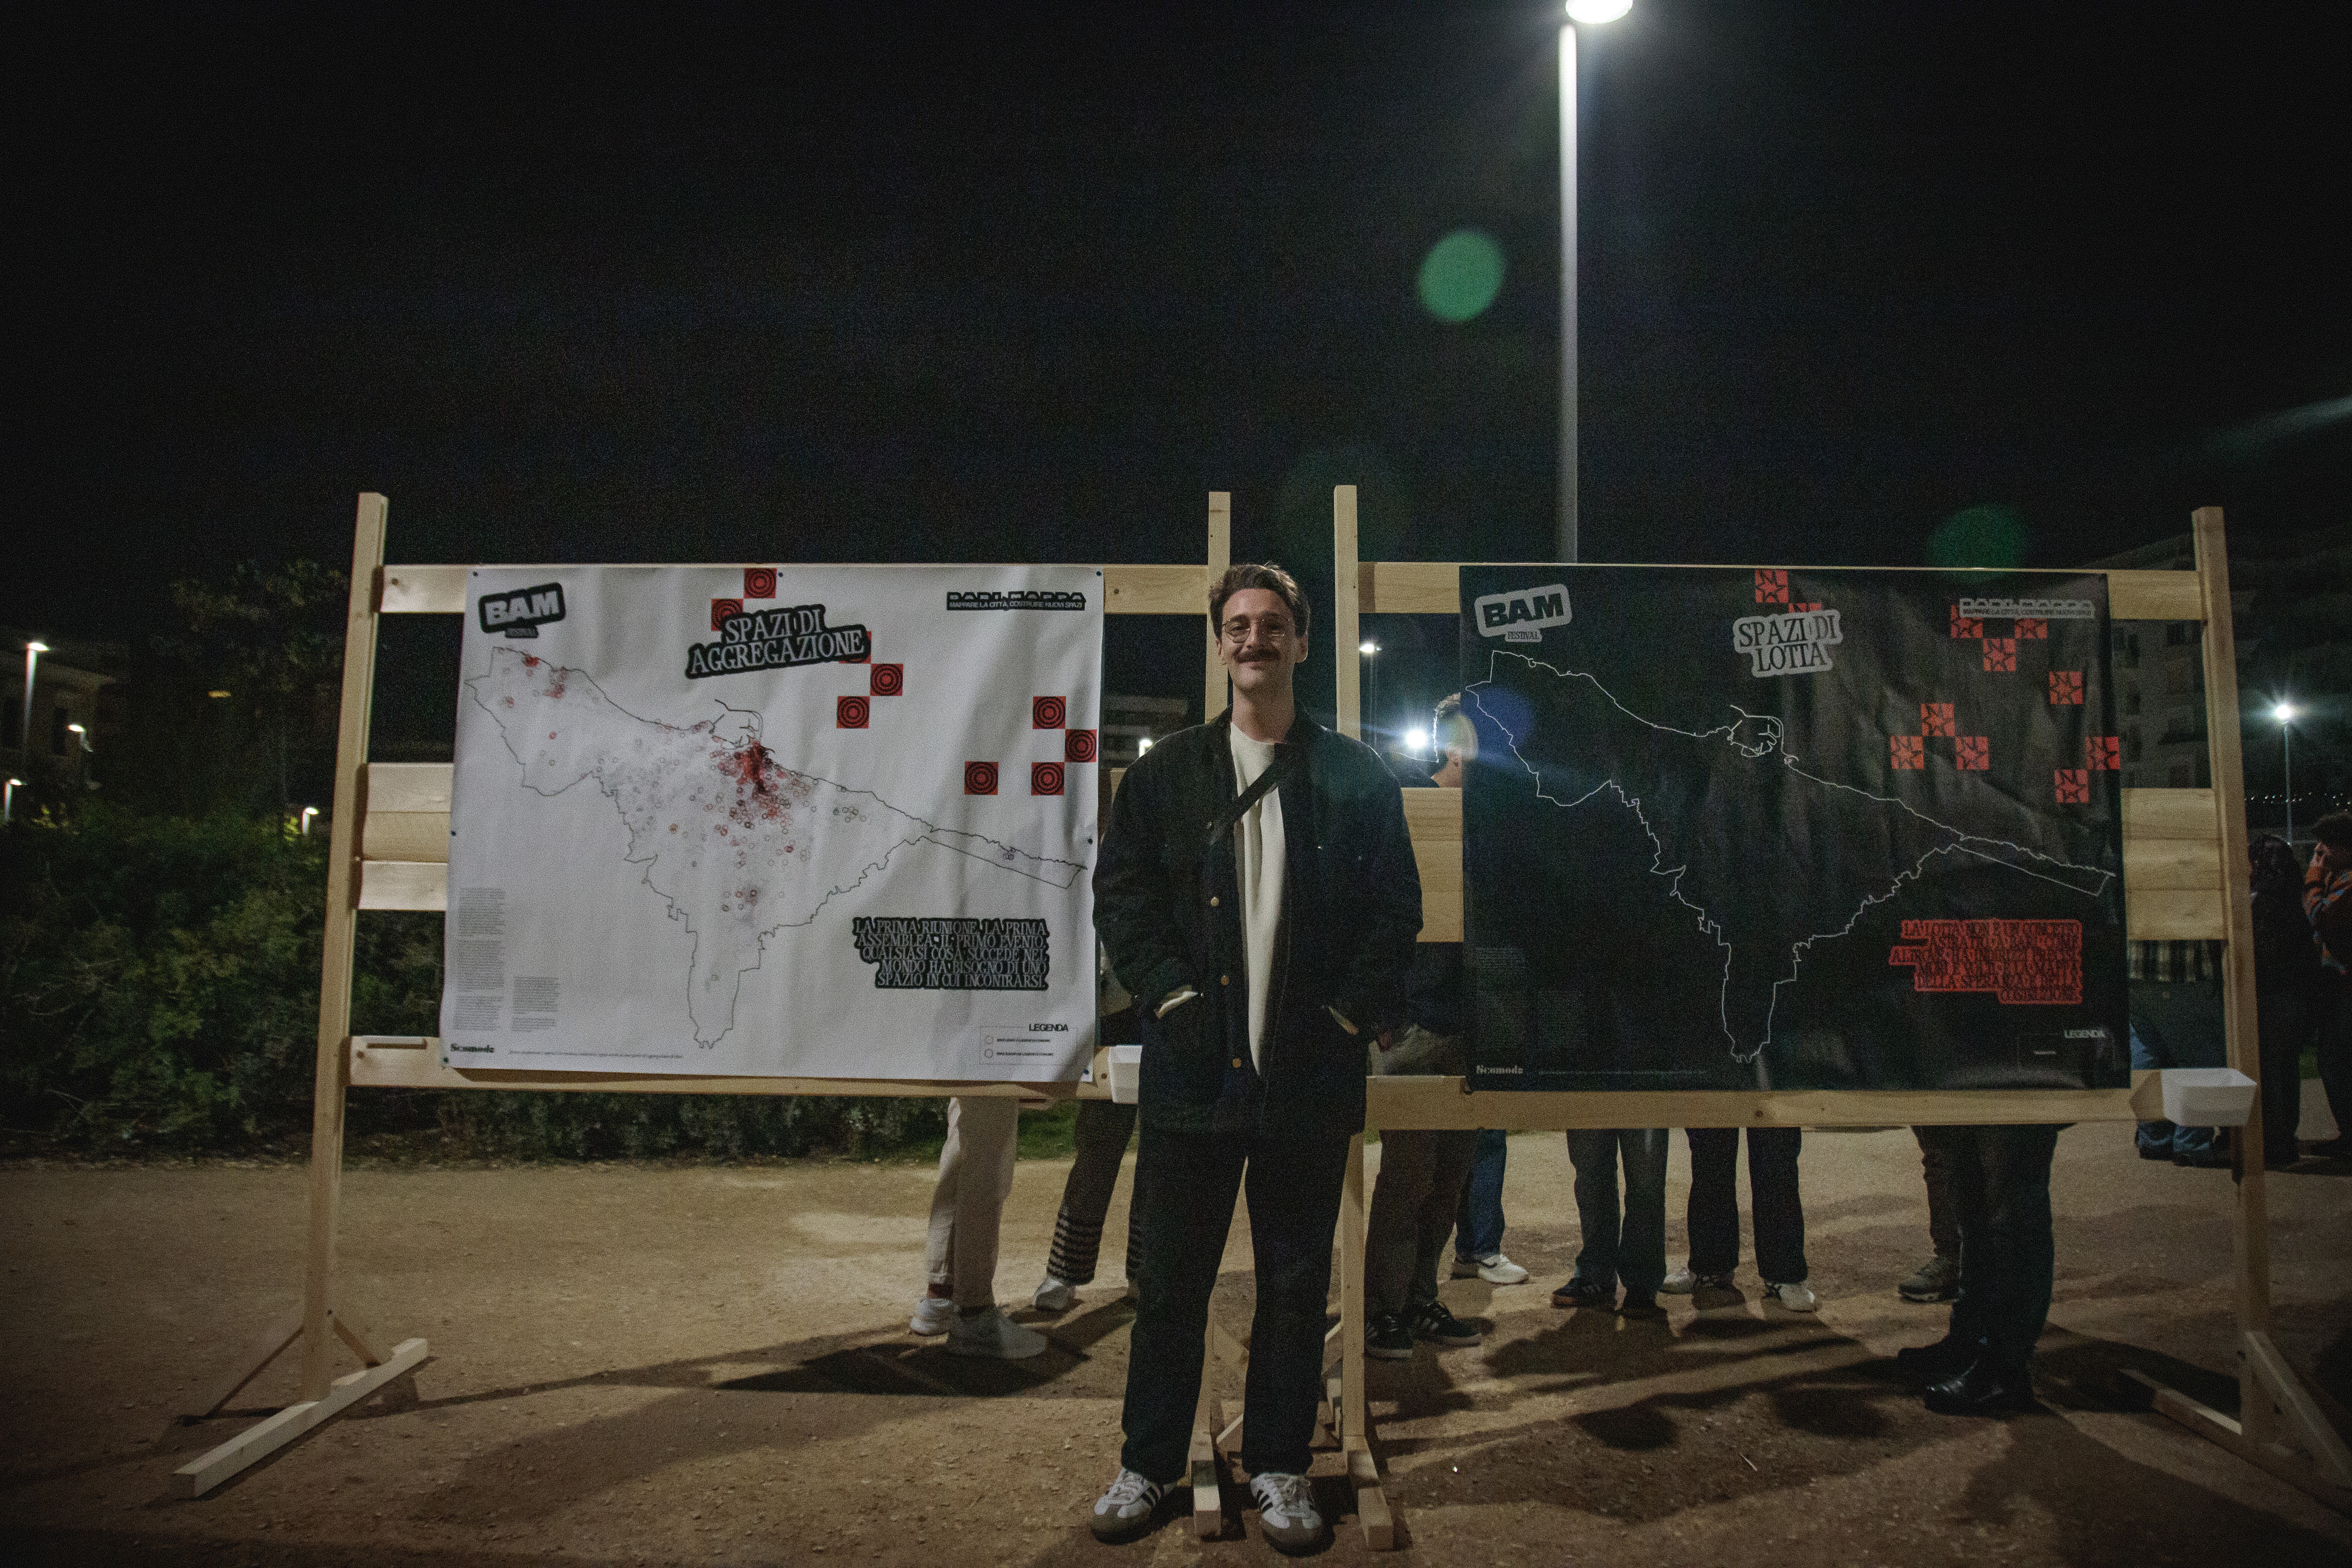
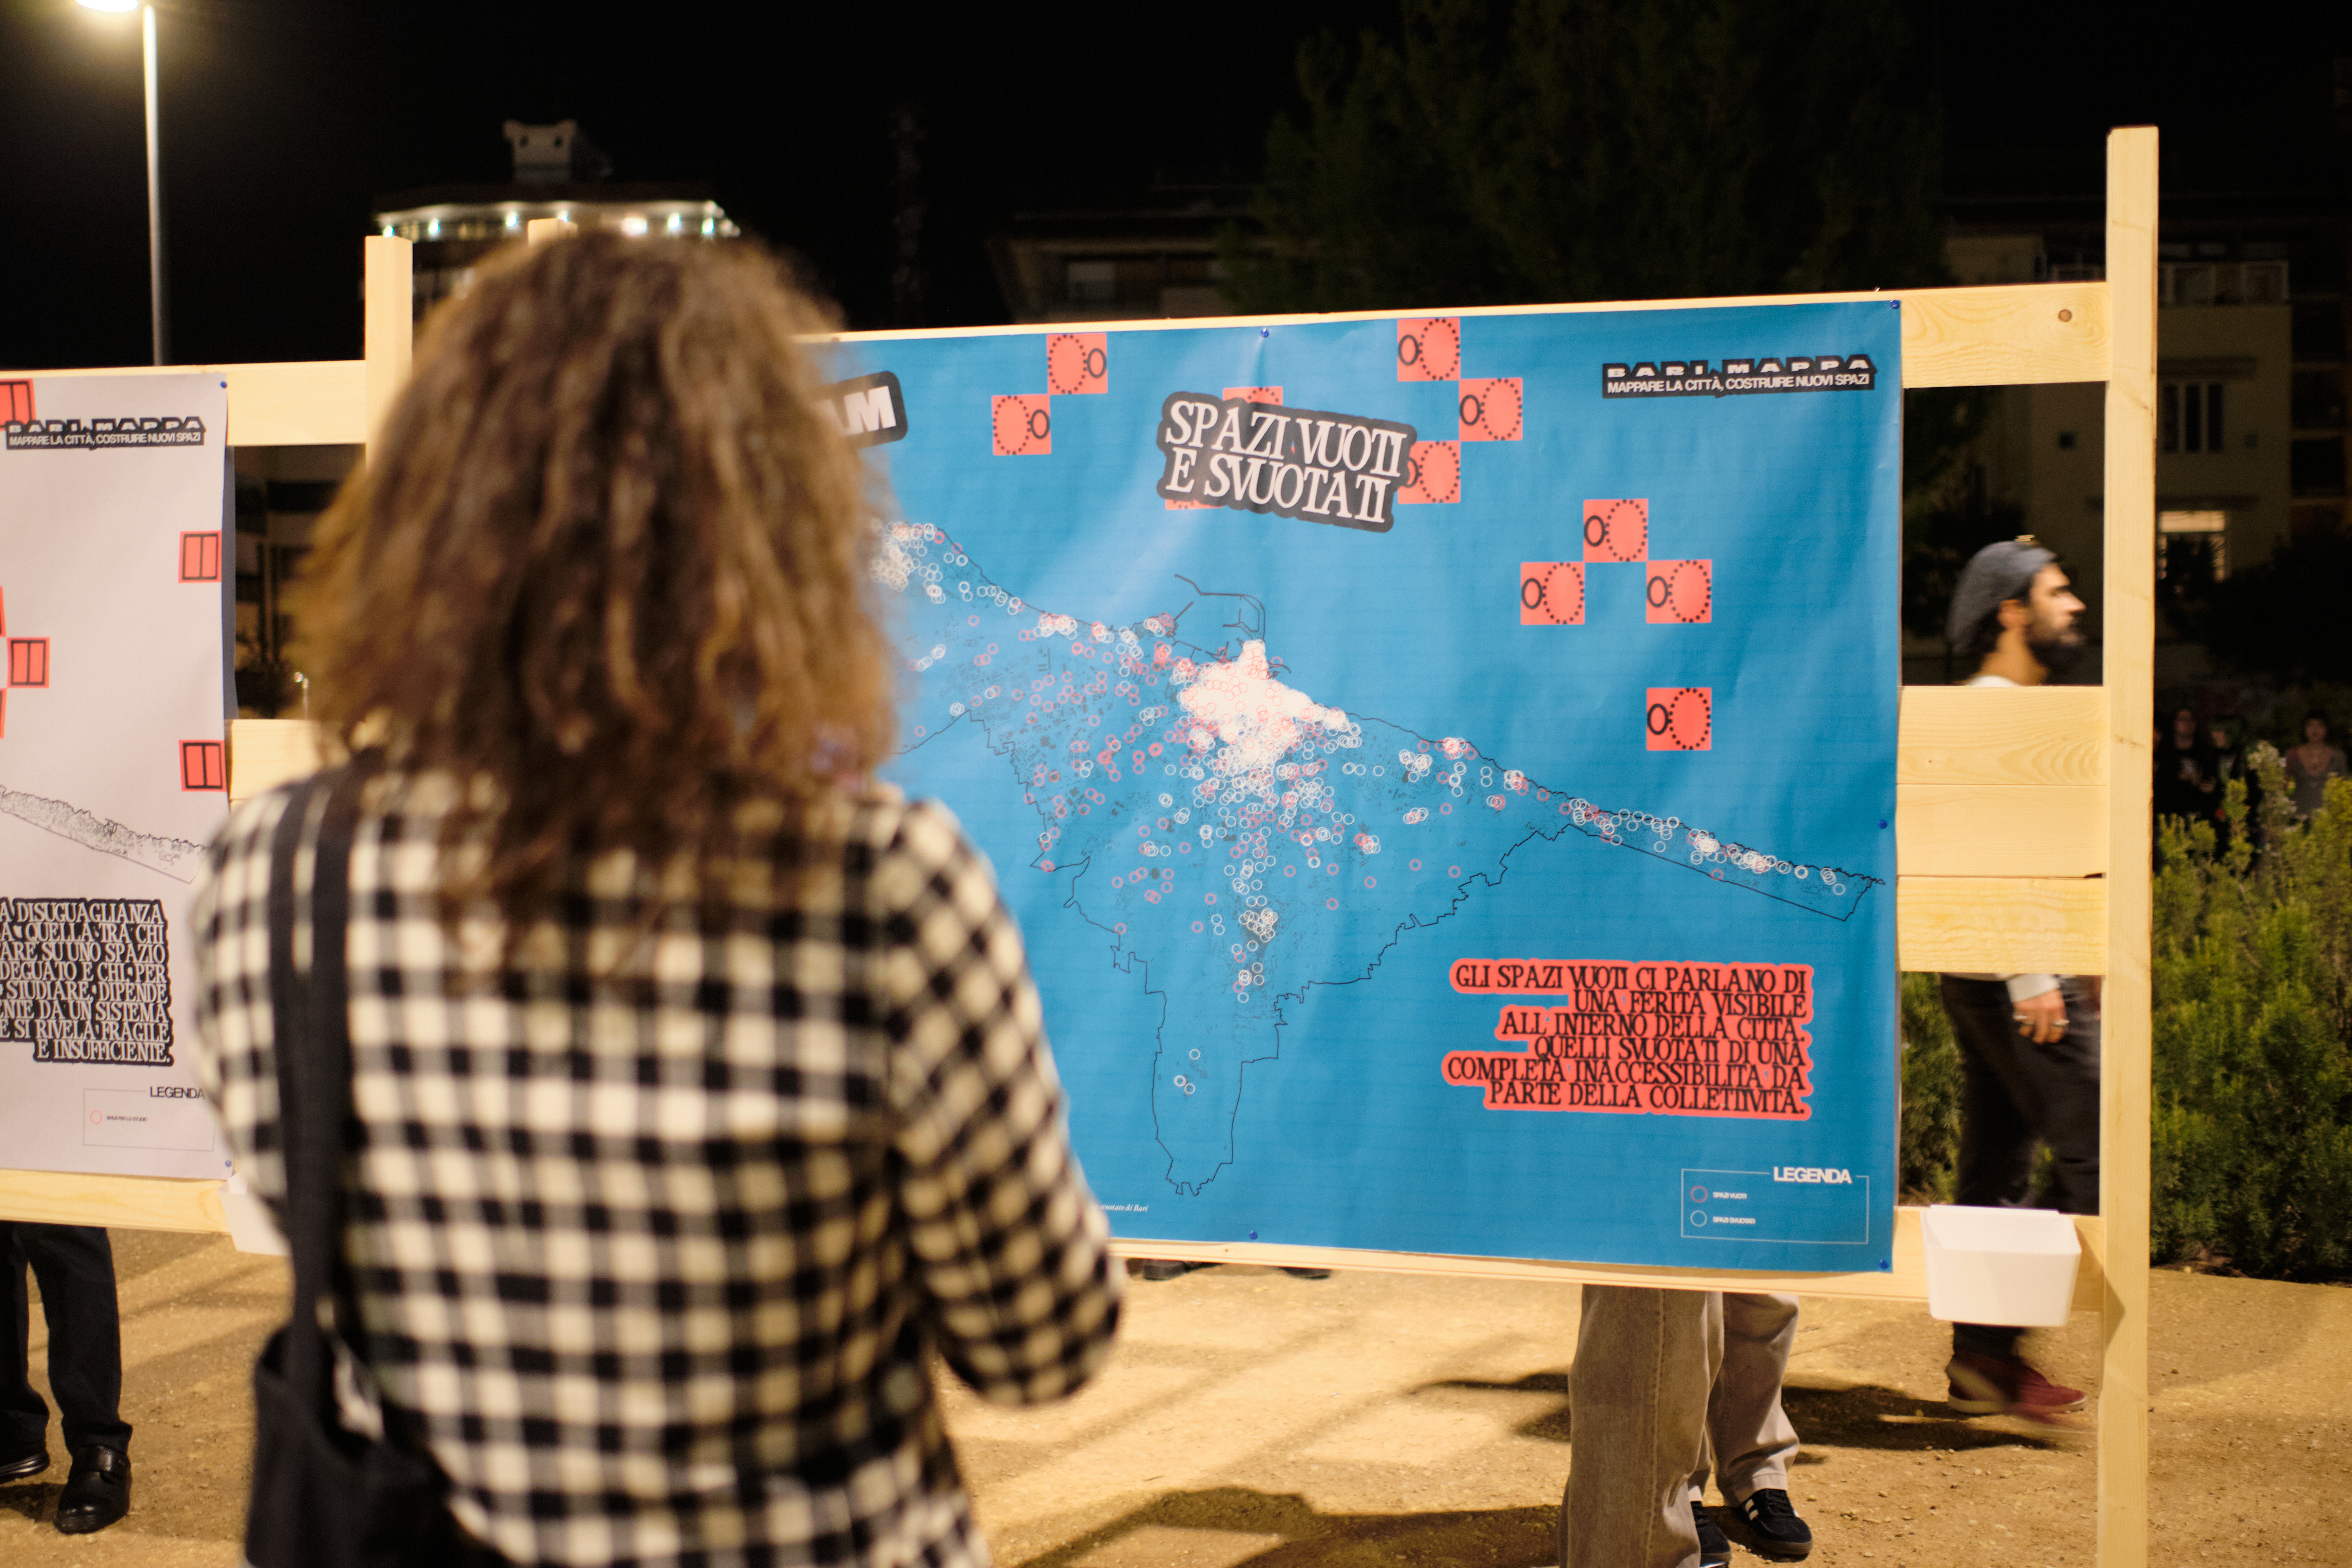
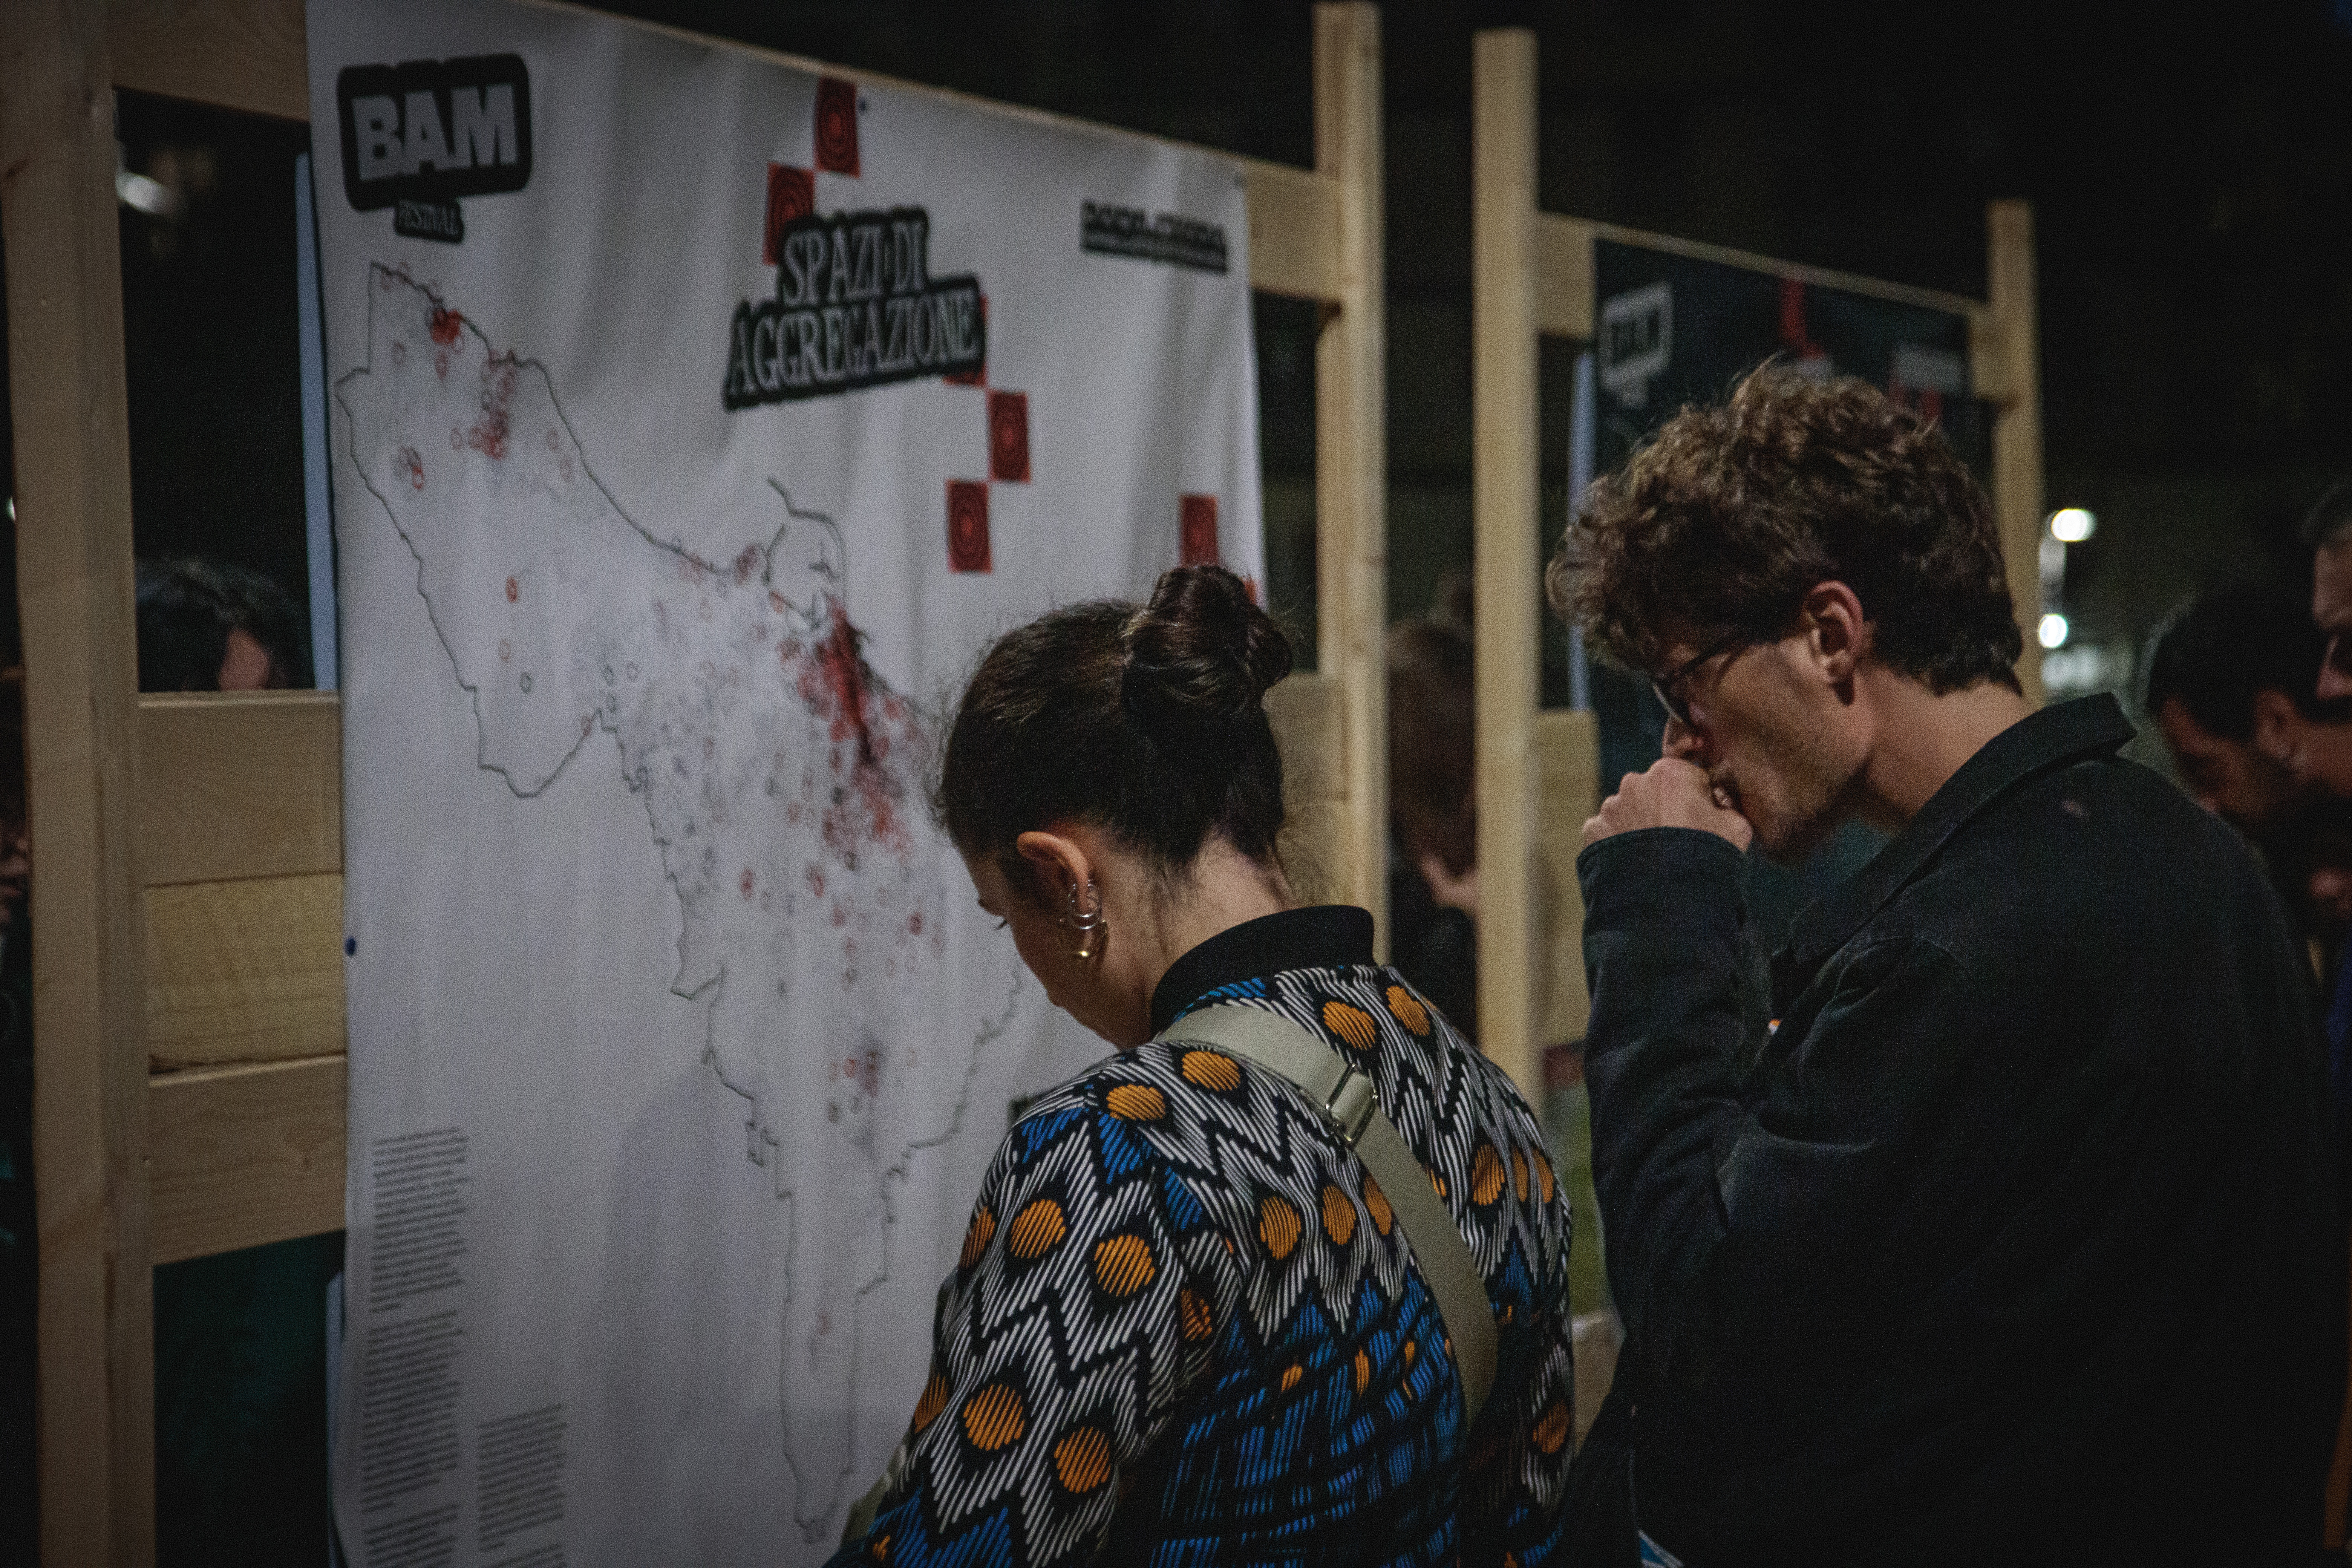
The maps generated using the tool were were featured at a festival organized by the association in October 2025 (see pictures below).
Both tools were built with a focus on accessibility, usability, and professional-grade output quality, ensuring that the resulting visualizations could serve both analytical and communicative purposes in the context of urban research and journalism.
A live version of both project is aviable at this page.