This project develops a comprehensive machine learning solution for predicting average viewer ratings of popular TV shows using from The Movie Database (TMDB). The work was developed as part of an interview process, demonstrating end-to-end data science capabilities from exploration through deployment. Working with a dataset of 10,000 TV shows, the project addresses the prediction challenge through both classification and regression approaches, providing insights into what factors influence TV show ratings. The entire project was completed in 5 days (starting December 26th, 2024) to deliver before New Year's Eve, as evidenced by the GitHub repository commit history.
The dataset originally contained 16 features including show metadata, popularity metrics, genre information, and viewer ratings. Through extensive exploratory data analysis and feature engineering, these were transformed into a refined set of predictive features including popularity scores, vote counts, release years, genre clusters, continental origins, and language macro-areas.
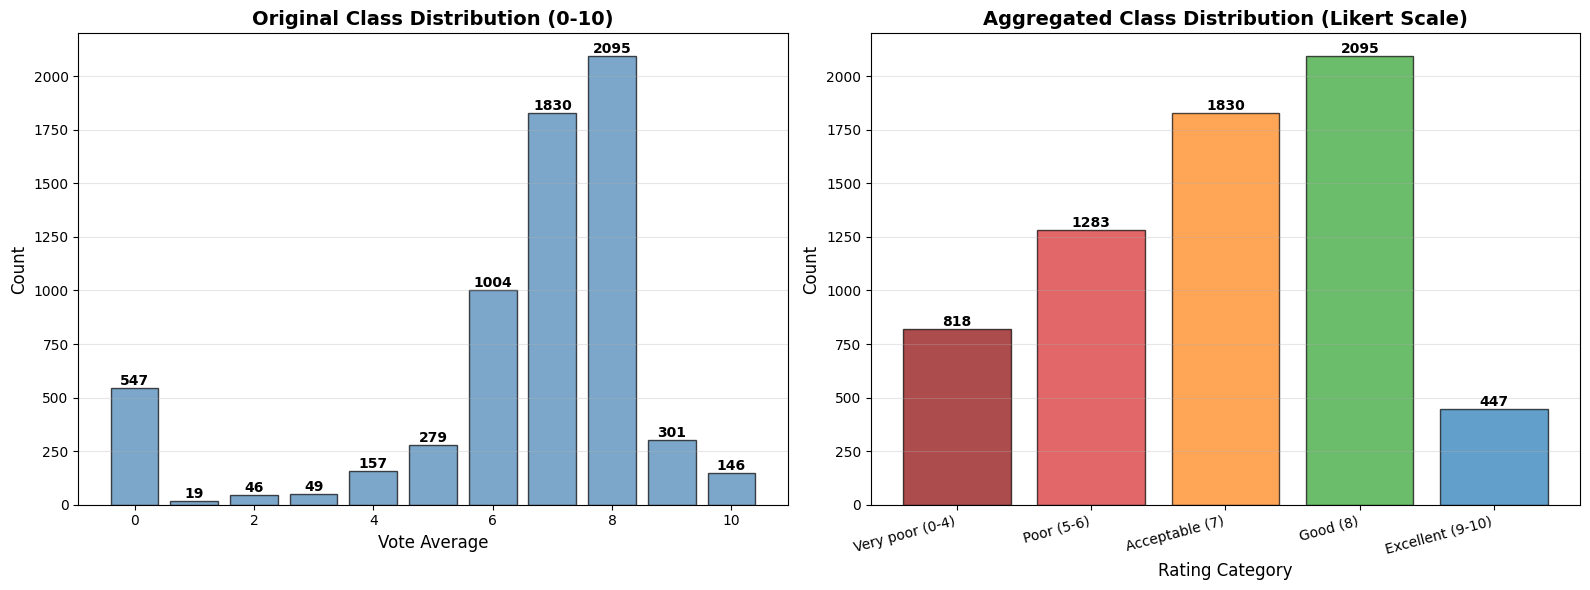
The dual approach of treating the prediction as both a classification problem (predicting rating categories 0-10) and a regression problem (predicting continuous rating values) allows for comprehensive model evaluation and comparison. The project demonstrates the complete machine learning pipeline from data exploration through model deployment, including advanced techniques like outlier detection ensemble methods, custom clustering for dimensionality reduction, and explainable AI for model interpretability.
This project provided extensive hands-on experience with the complete data science workflow and involved working on several critical areas:
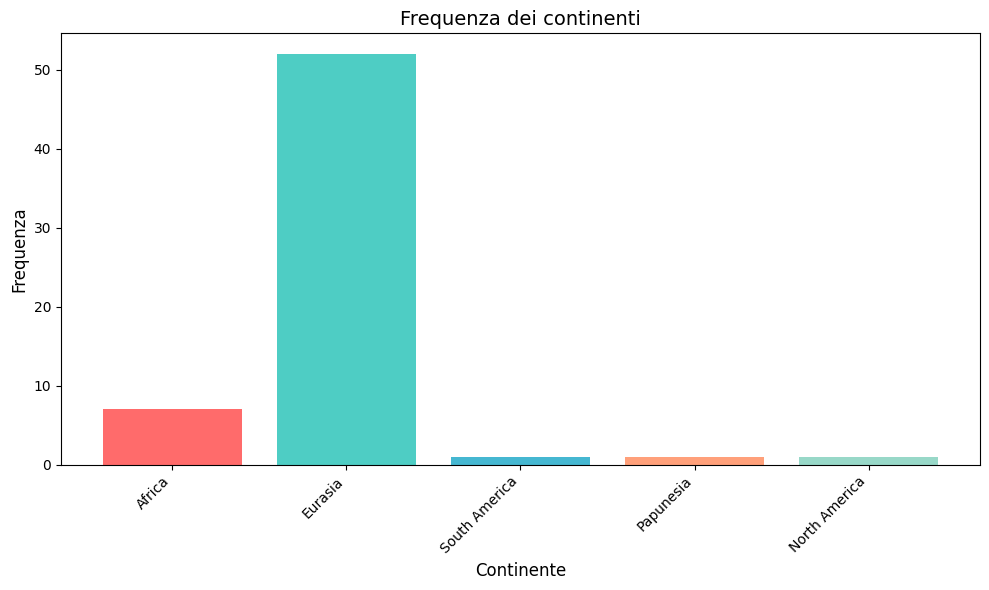
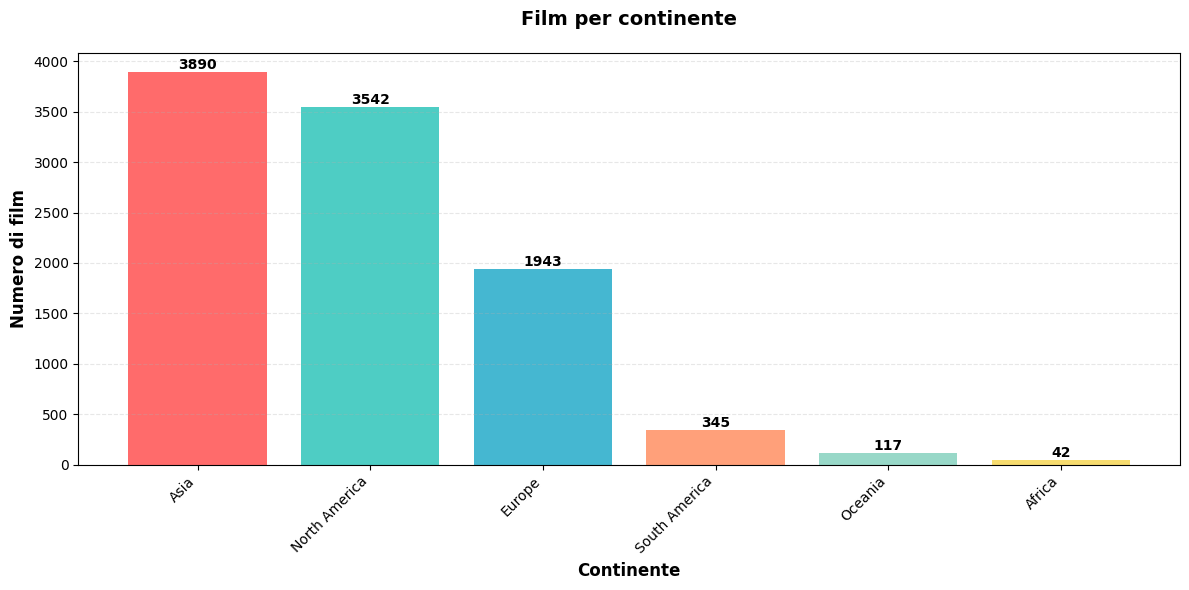
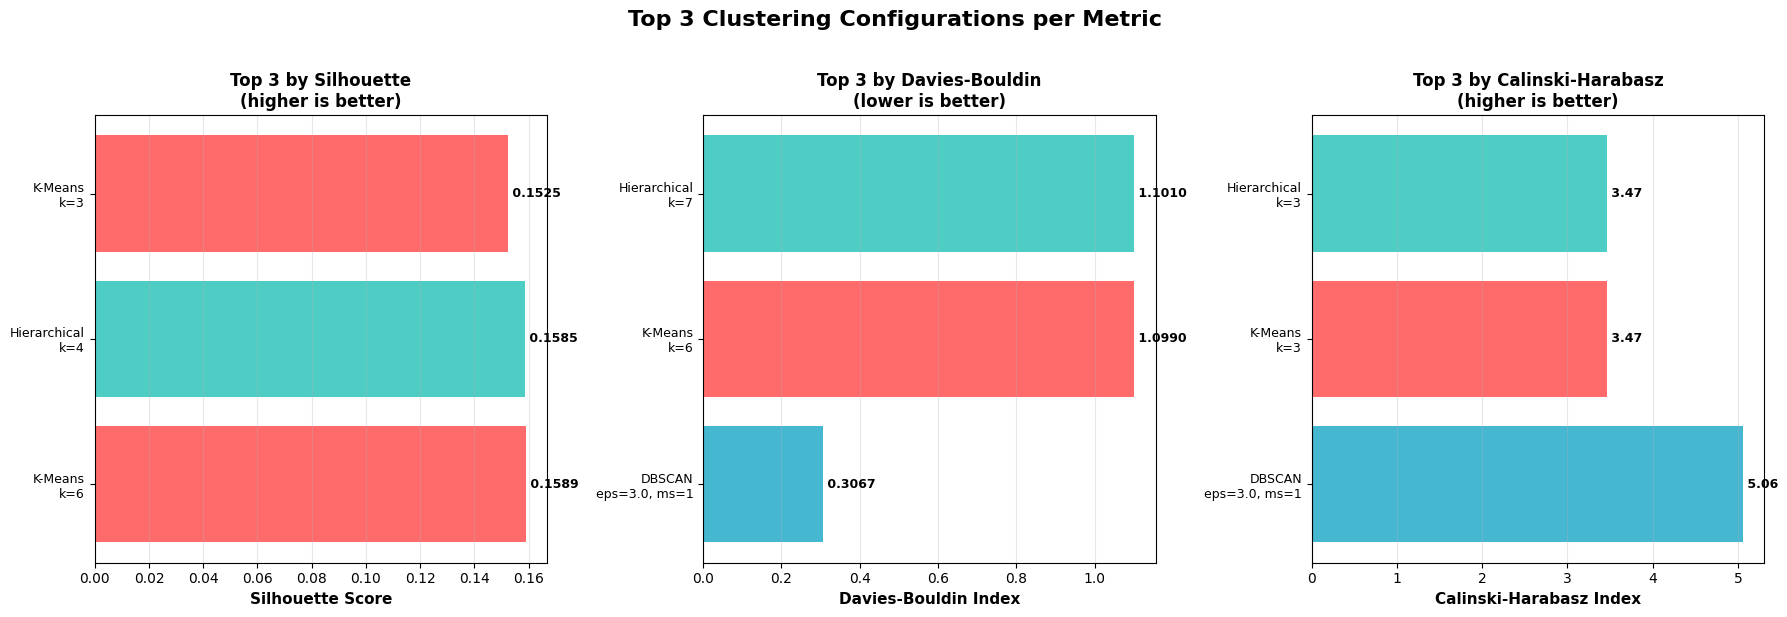
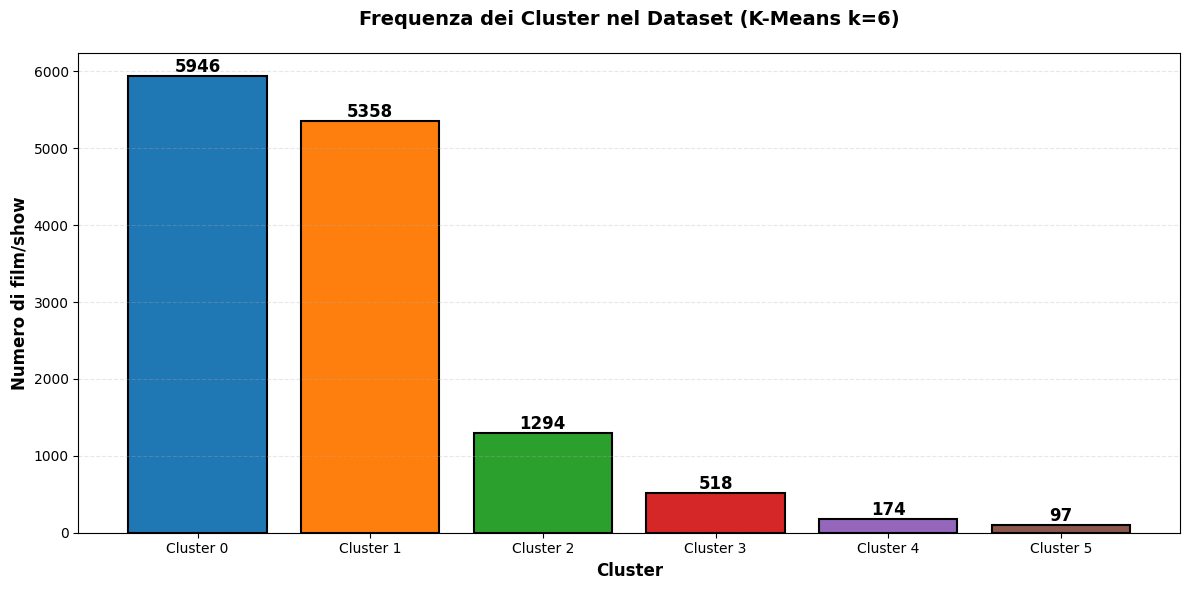
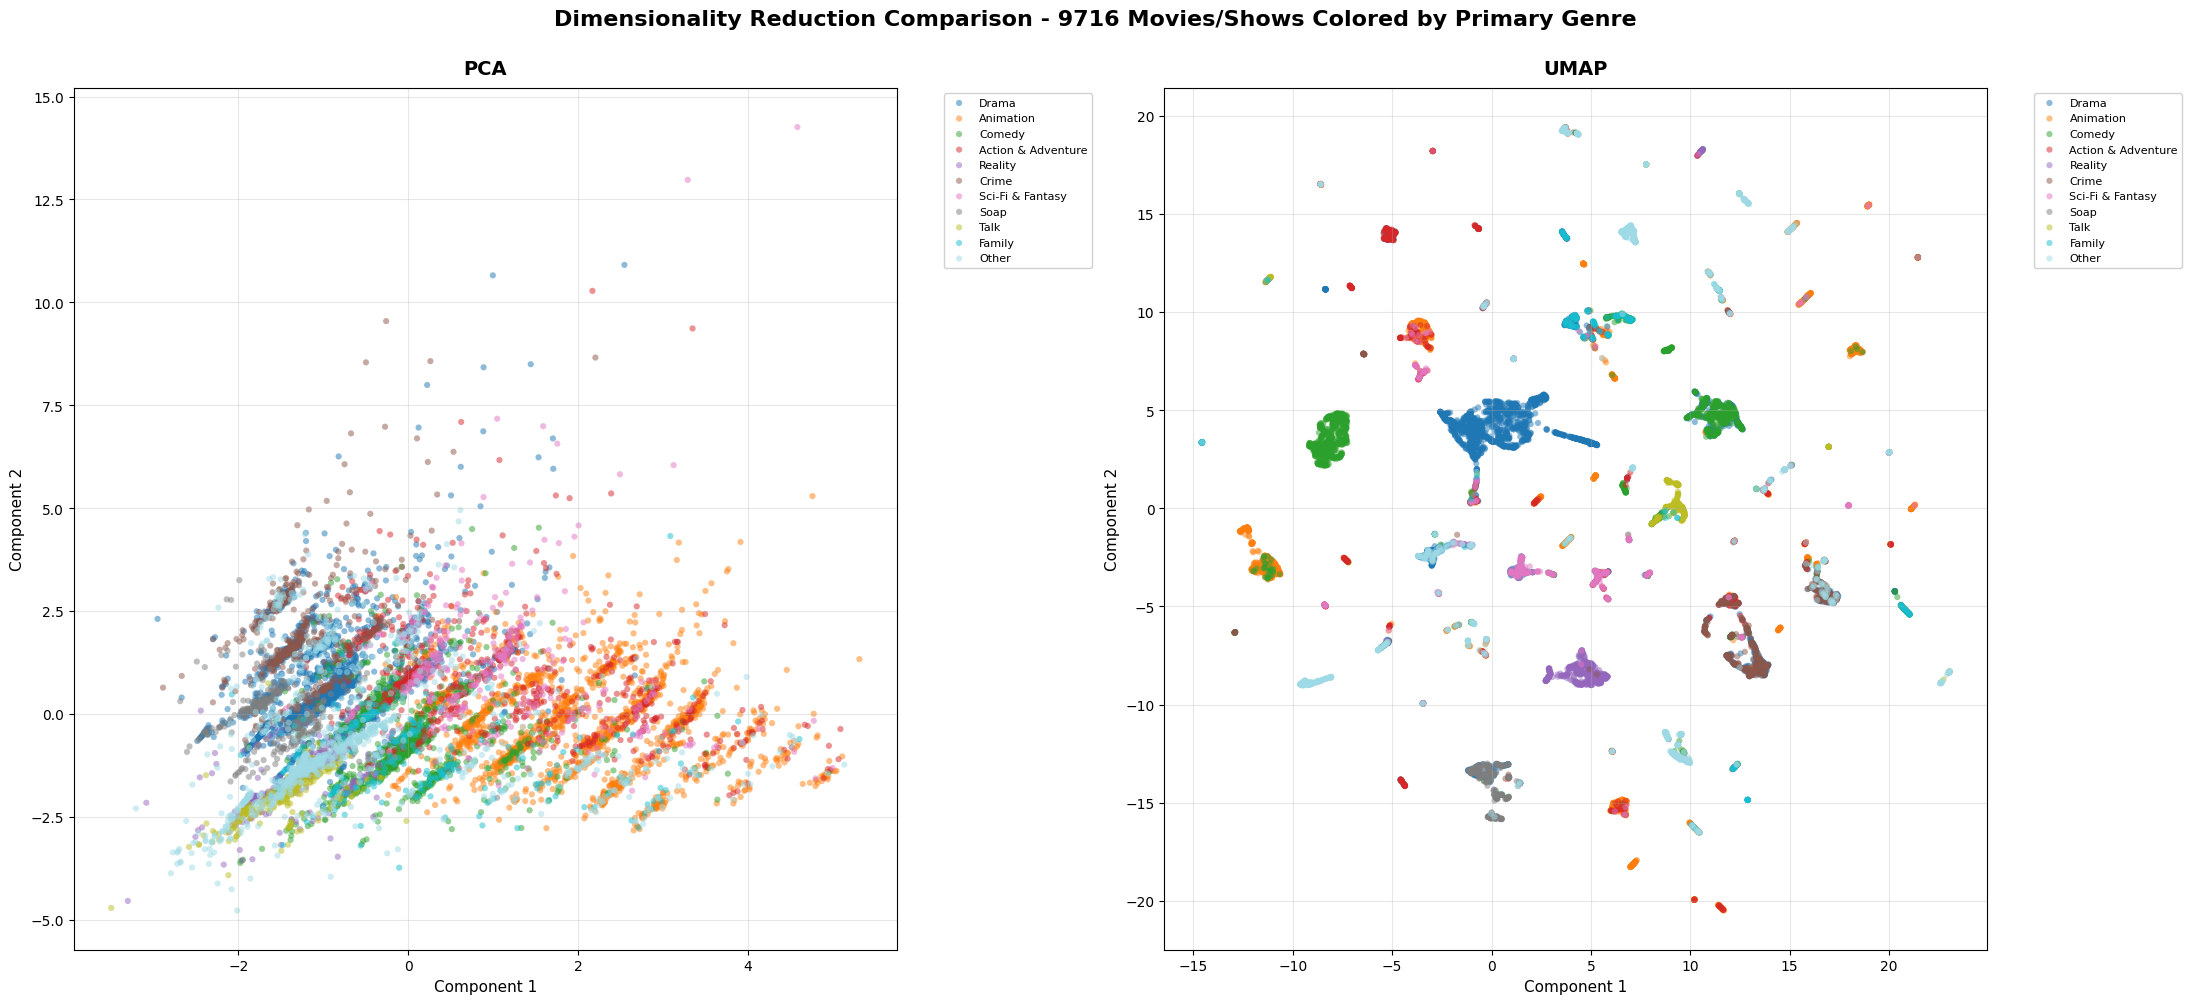
Feature Engineering and Domain Knowledge: I transformed raw categorical data into meaningful features through creative approaches. The genre clustering exercise, where I reduced 35 distinct genres to 6 clusters using multiple algorithms (K-Means, Hierarchical, DBSCAN) and evaluation metrics (Silhouette, Davies-Bouldin, Calinski-Harabasz), required balancing dimensionality reduction with information preservation. Mapping languages to macro-areas and countries to continents demonstrated the importance of domain knowledge in feature creation.
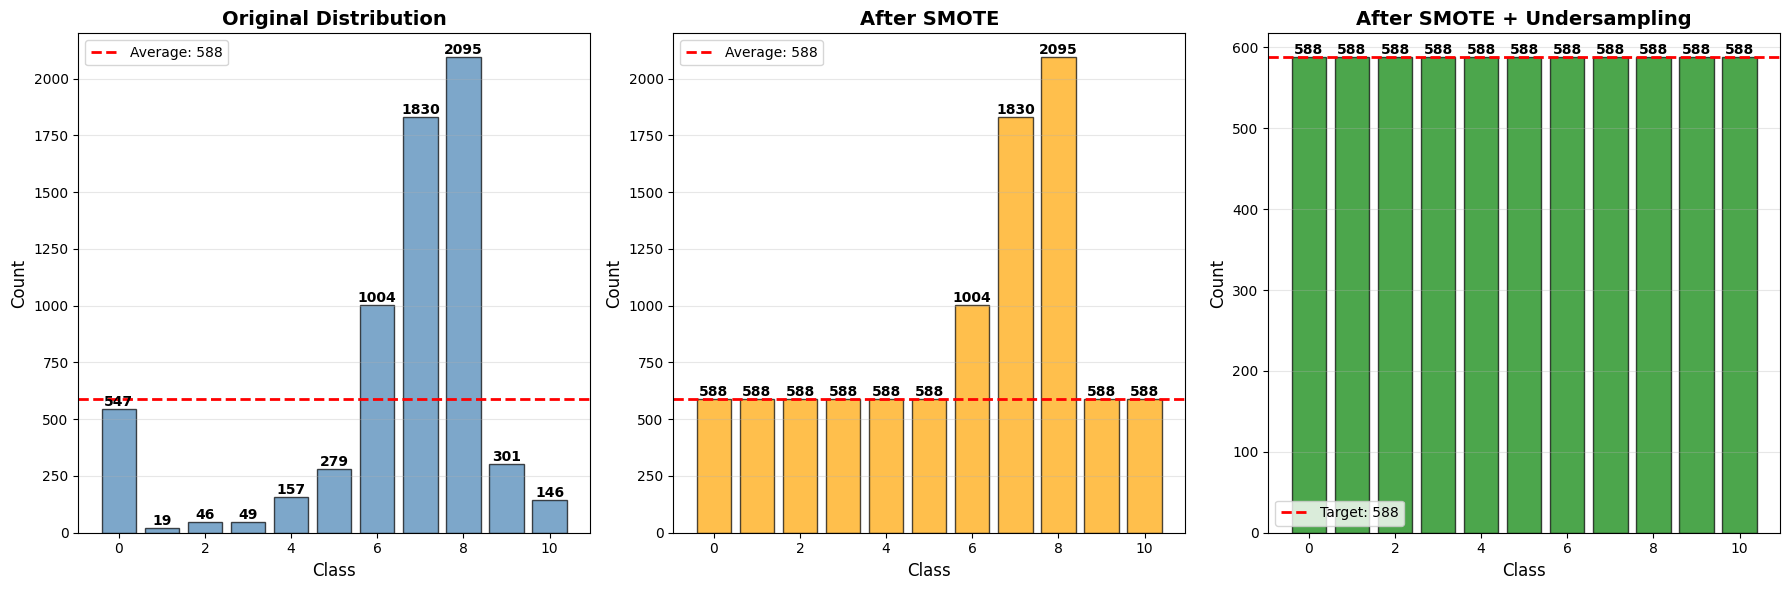
Handling Imbalanced Data: The project presented a significant challenge with highly imbalanced target classes. I explored various techniques including SMOTE for oversampling minority classes, random undersampling for majority classes, and combined approaches. This taught me that sometimes the "obvious" solution (balancing classes) doesn't always yield better results—the unbalanced dataset actually performed better in this case, highlighting the importance of empirical testing over assumptions.
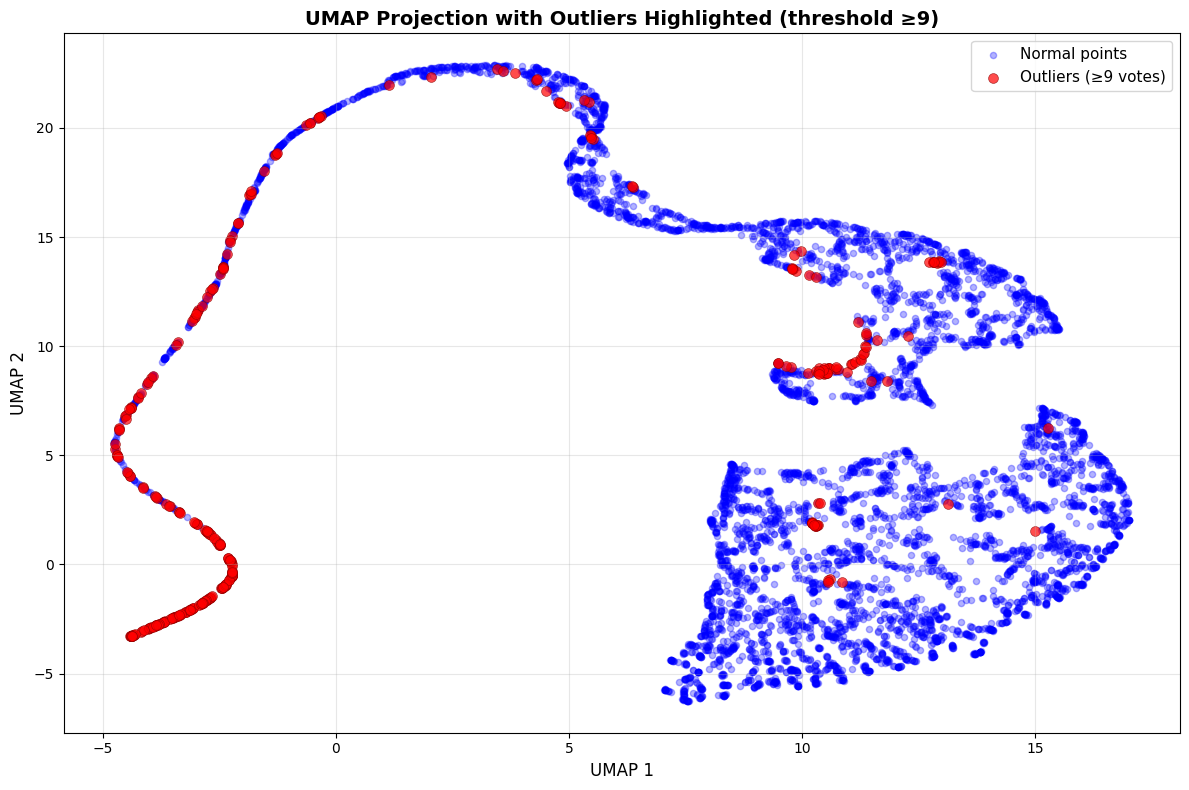
Outlier Detection Ensemble Methods: Rather than relying on a single outlier detection technique, I implemented an ensemble approach testing 13 different methods (Z-Score variants, IQR, Isolation Forest, LOF, KNN, DBSCAN). By requiring consensus across multiple methods (threshold of 9+ methods agreeing), I created more robust outlier detection that reduces false positives while maintaining effectiveness. This ensemble thinking is applicable beyond just outlier detection.
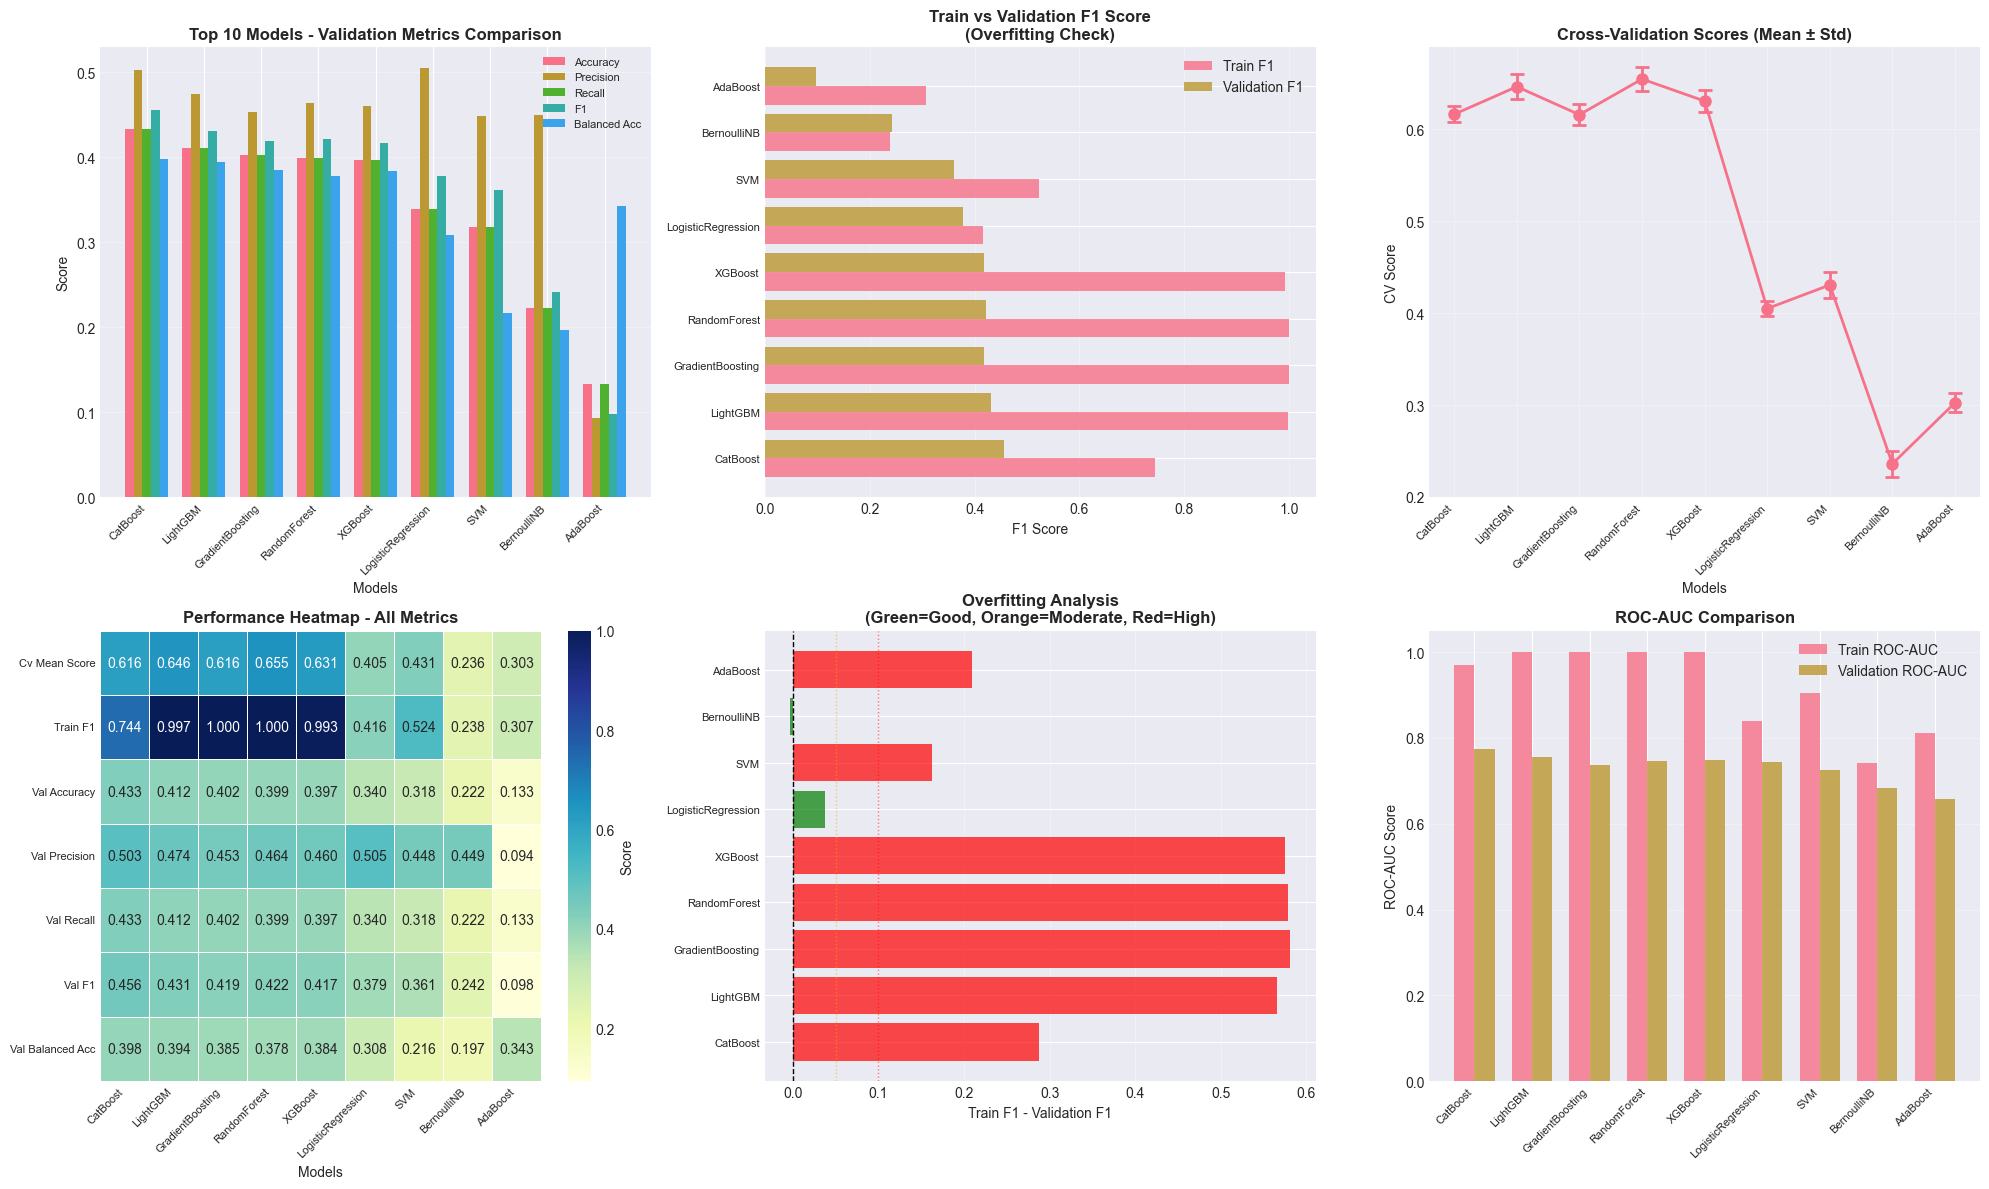
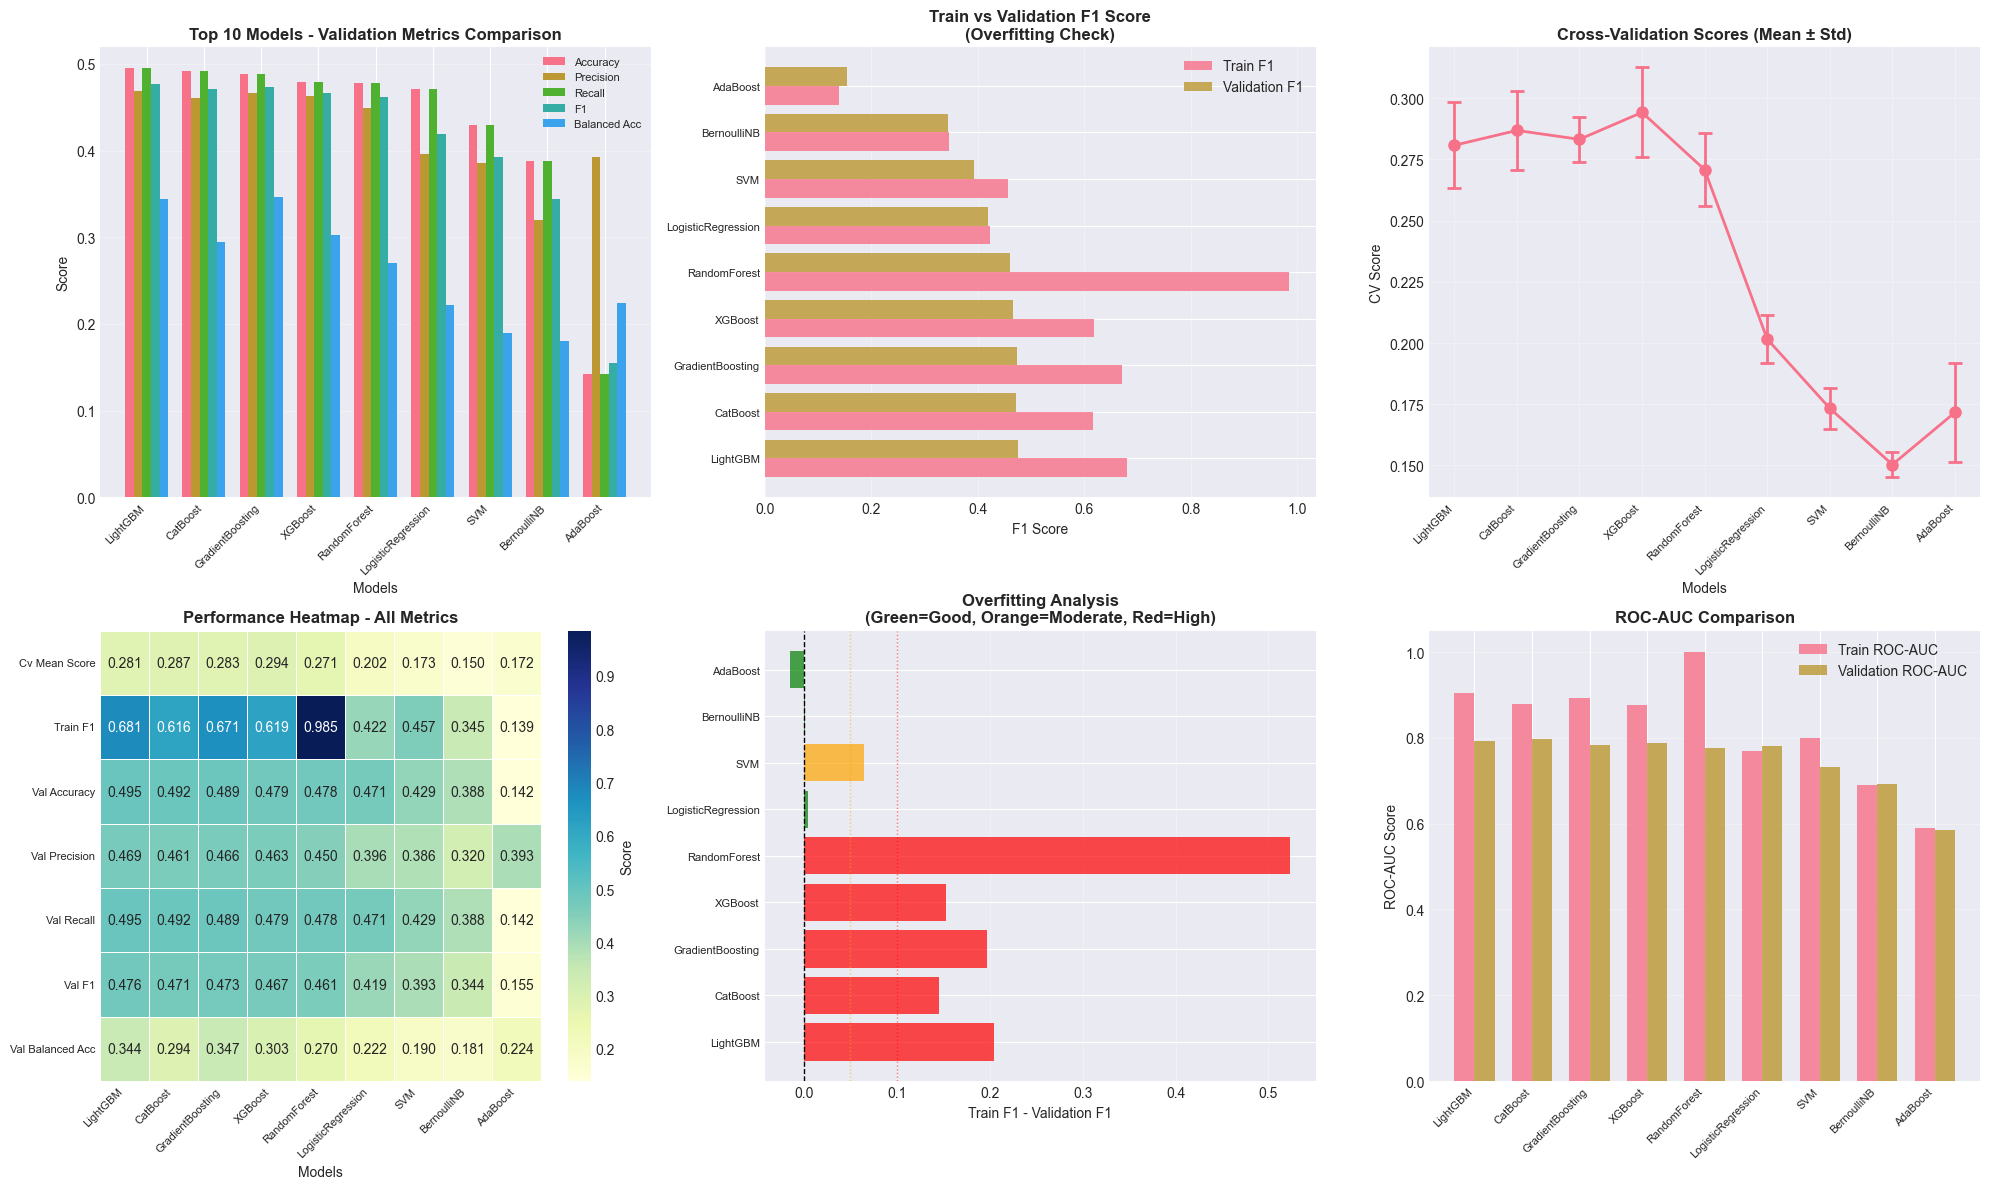
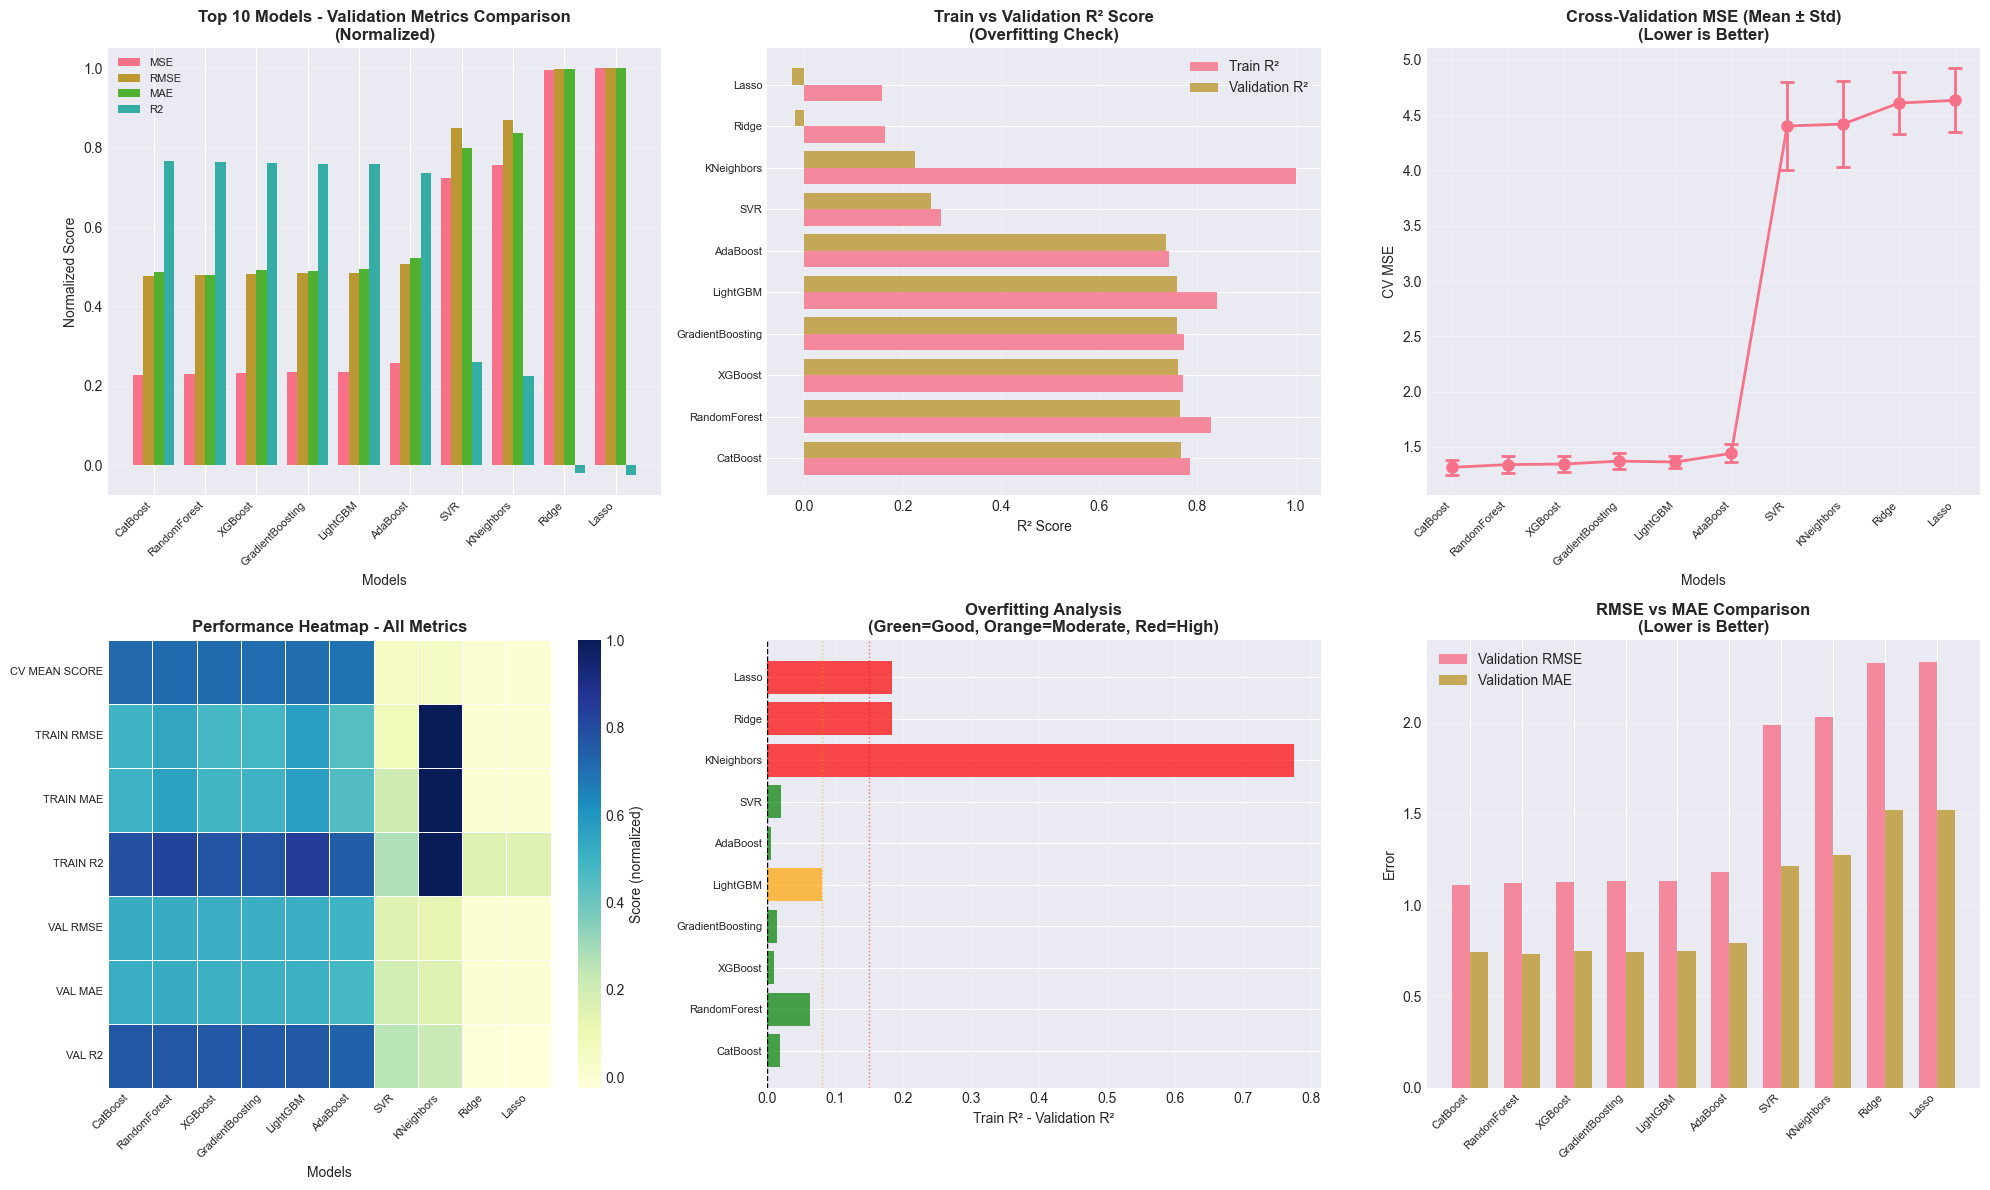
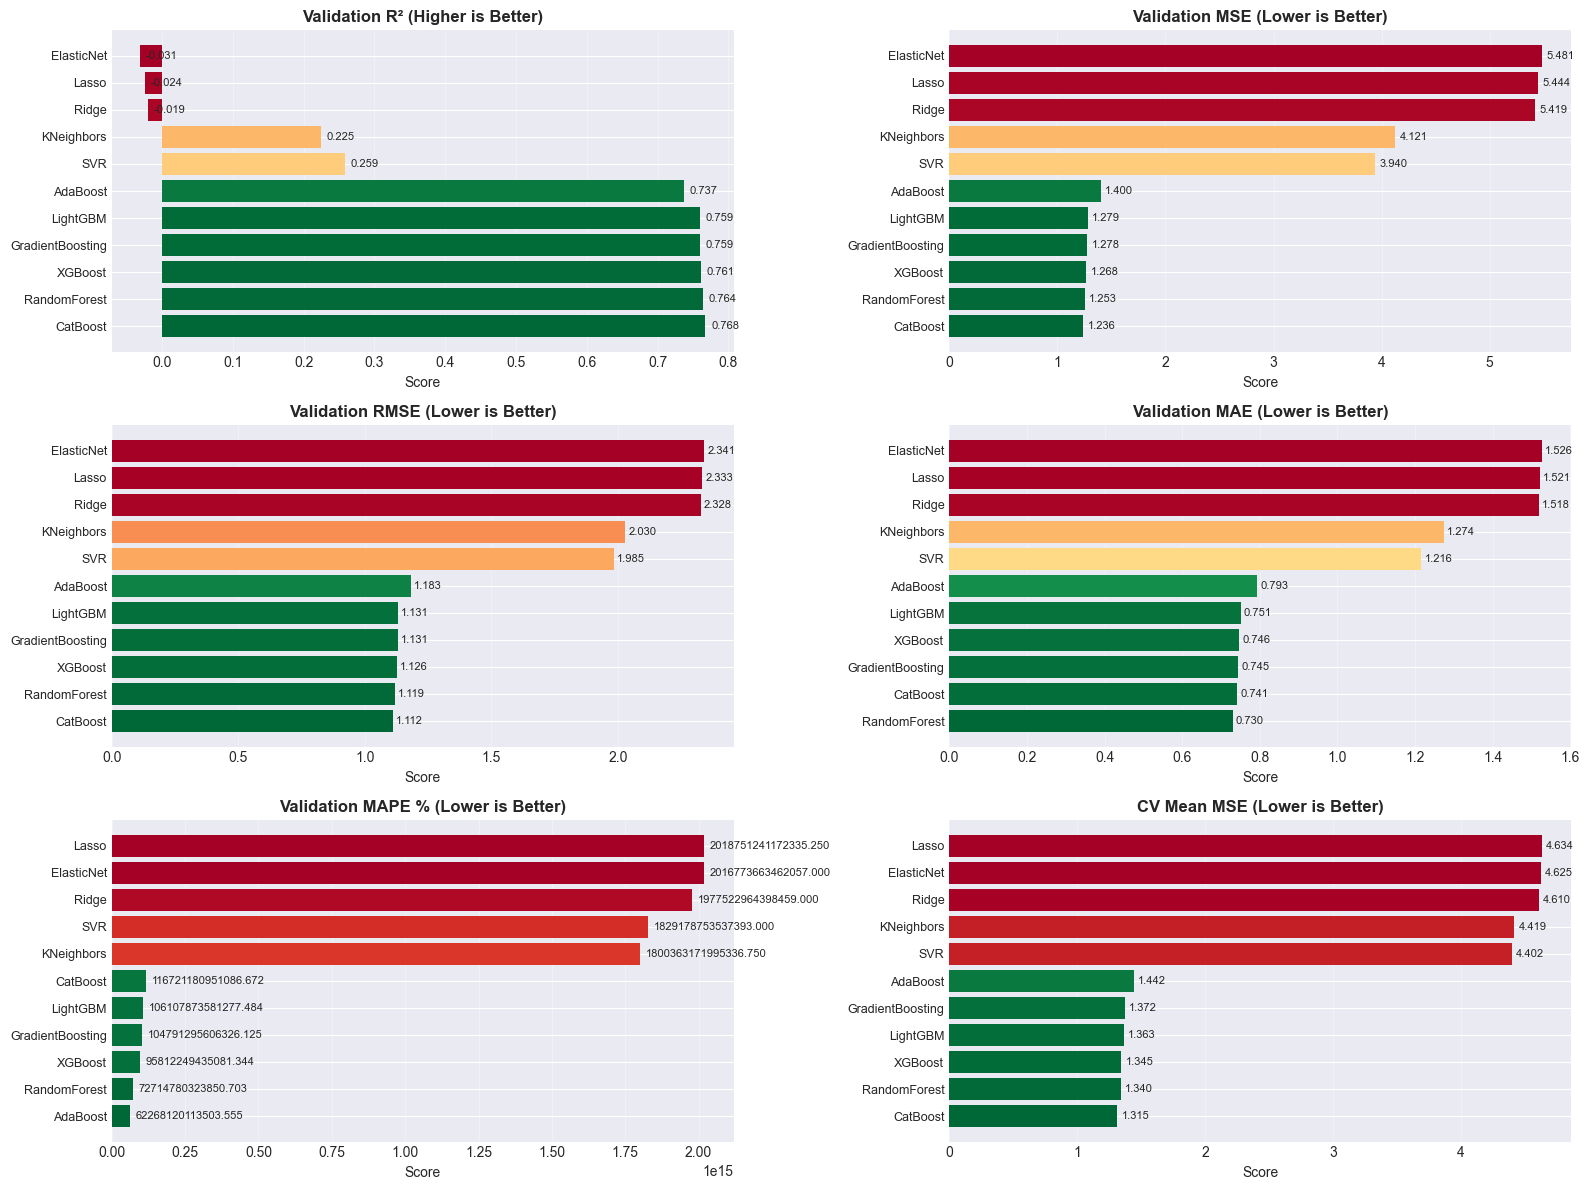
Model Selection and Hyperparameter Tuning: Working with multiple model families (tree-based: Random Forest, AdaBoost, Gradient Boosting, LightGBM, XGBoost, CatBoost; linear: Logistic/Ridge/Lasso Regression; probabilistic: Naive Bayes; instance-based: SVM, KNN) demonstrated how different algorithms have different strengths. The systematic grid search with cross-validation (k=5 initially, then k=10 for fine-tuning) showed the importance of methodical experimentation. I learned that gradient boosting methods (especially LightGBM and CatBoost) excel at tabular data with mixed feature types.
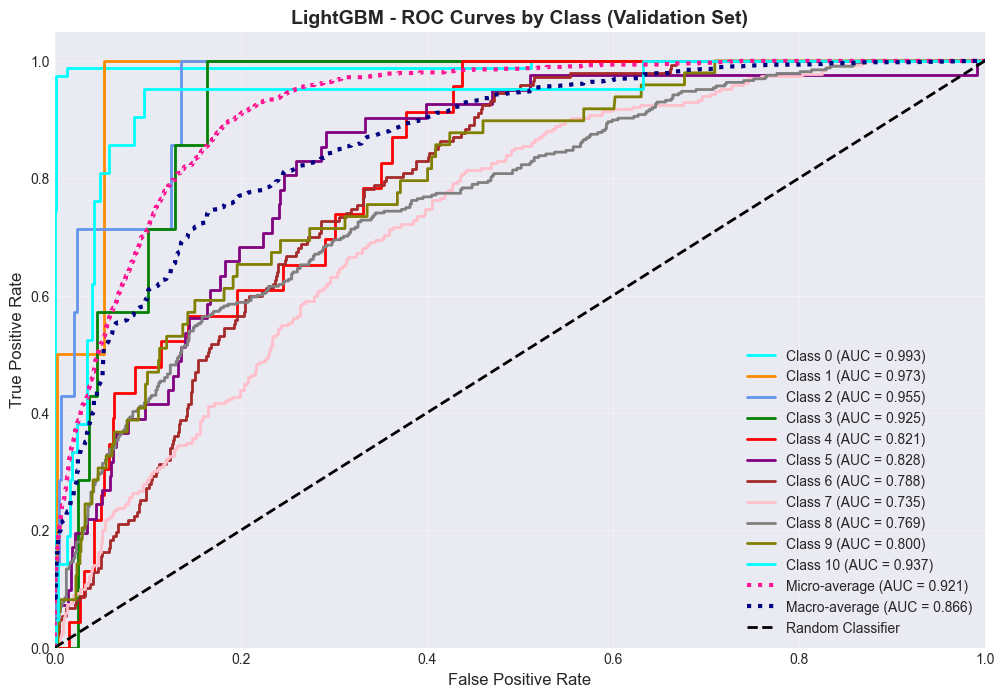
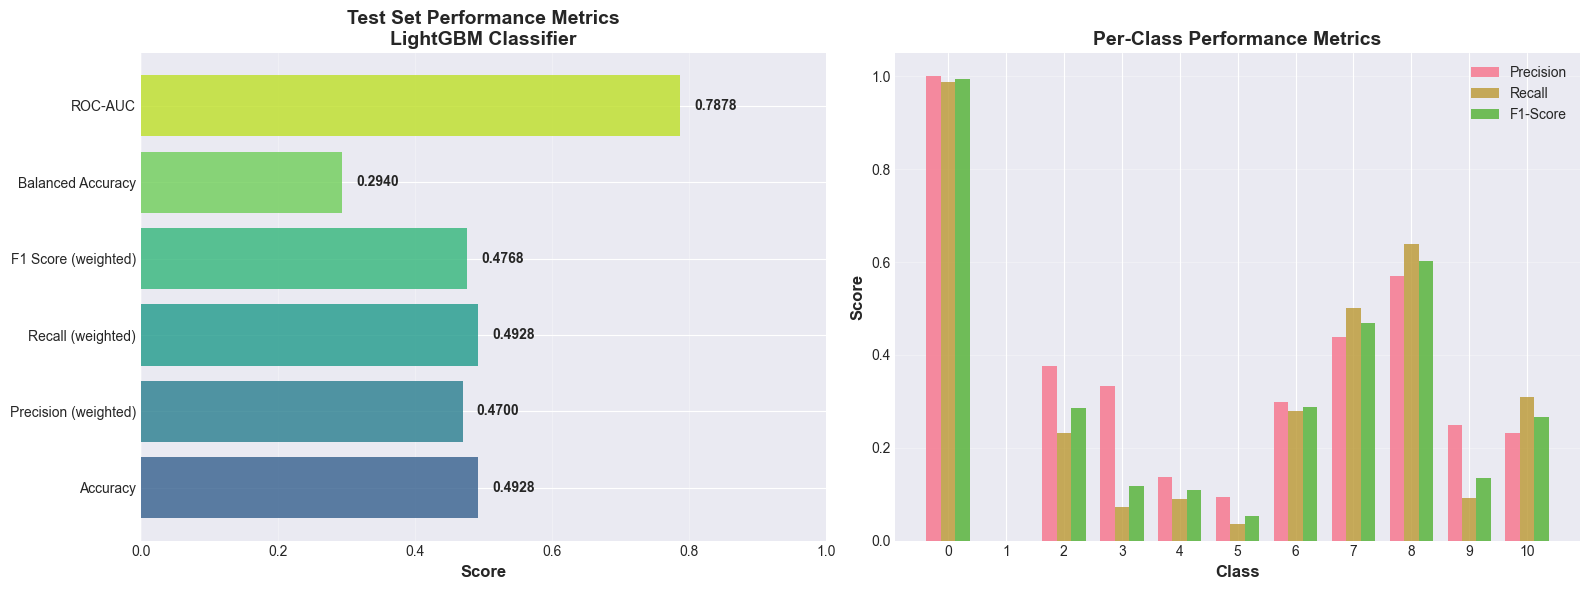
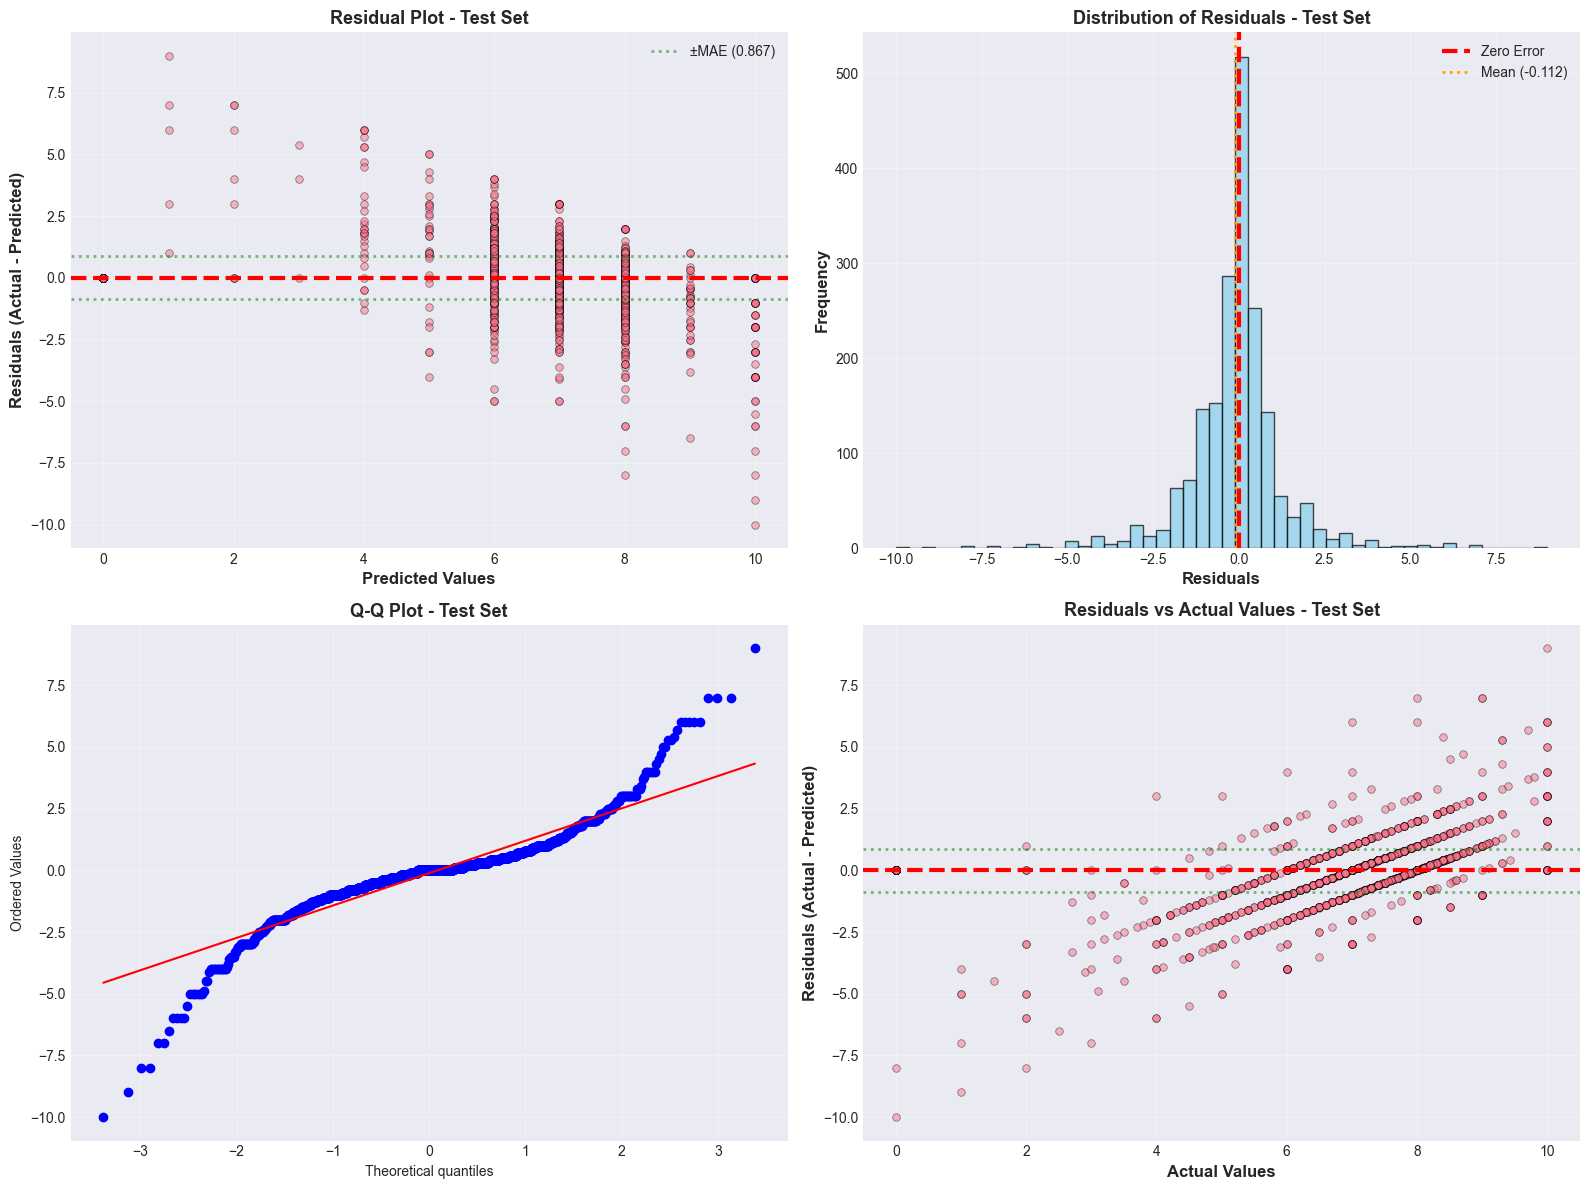
Evaluation Metrics for Different Problems: For classification, I looked beyond simple accuracy, using precision, recall, F1-score, balanced accuracy, and ROC-AUC to get a complete picture, especially with imbalanced classes. For regression, understanding the differences between MSE, RMSE, MAE, R², and MAPE helped me evaluate model performance from multiple perspectives. The MAPE of 16.71% for the final regressor provided an interpretable measure of average prediction error.
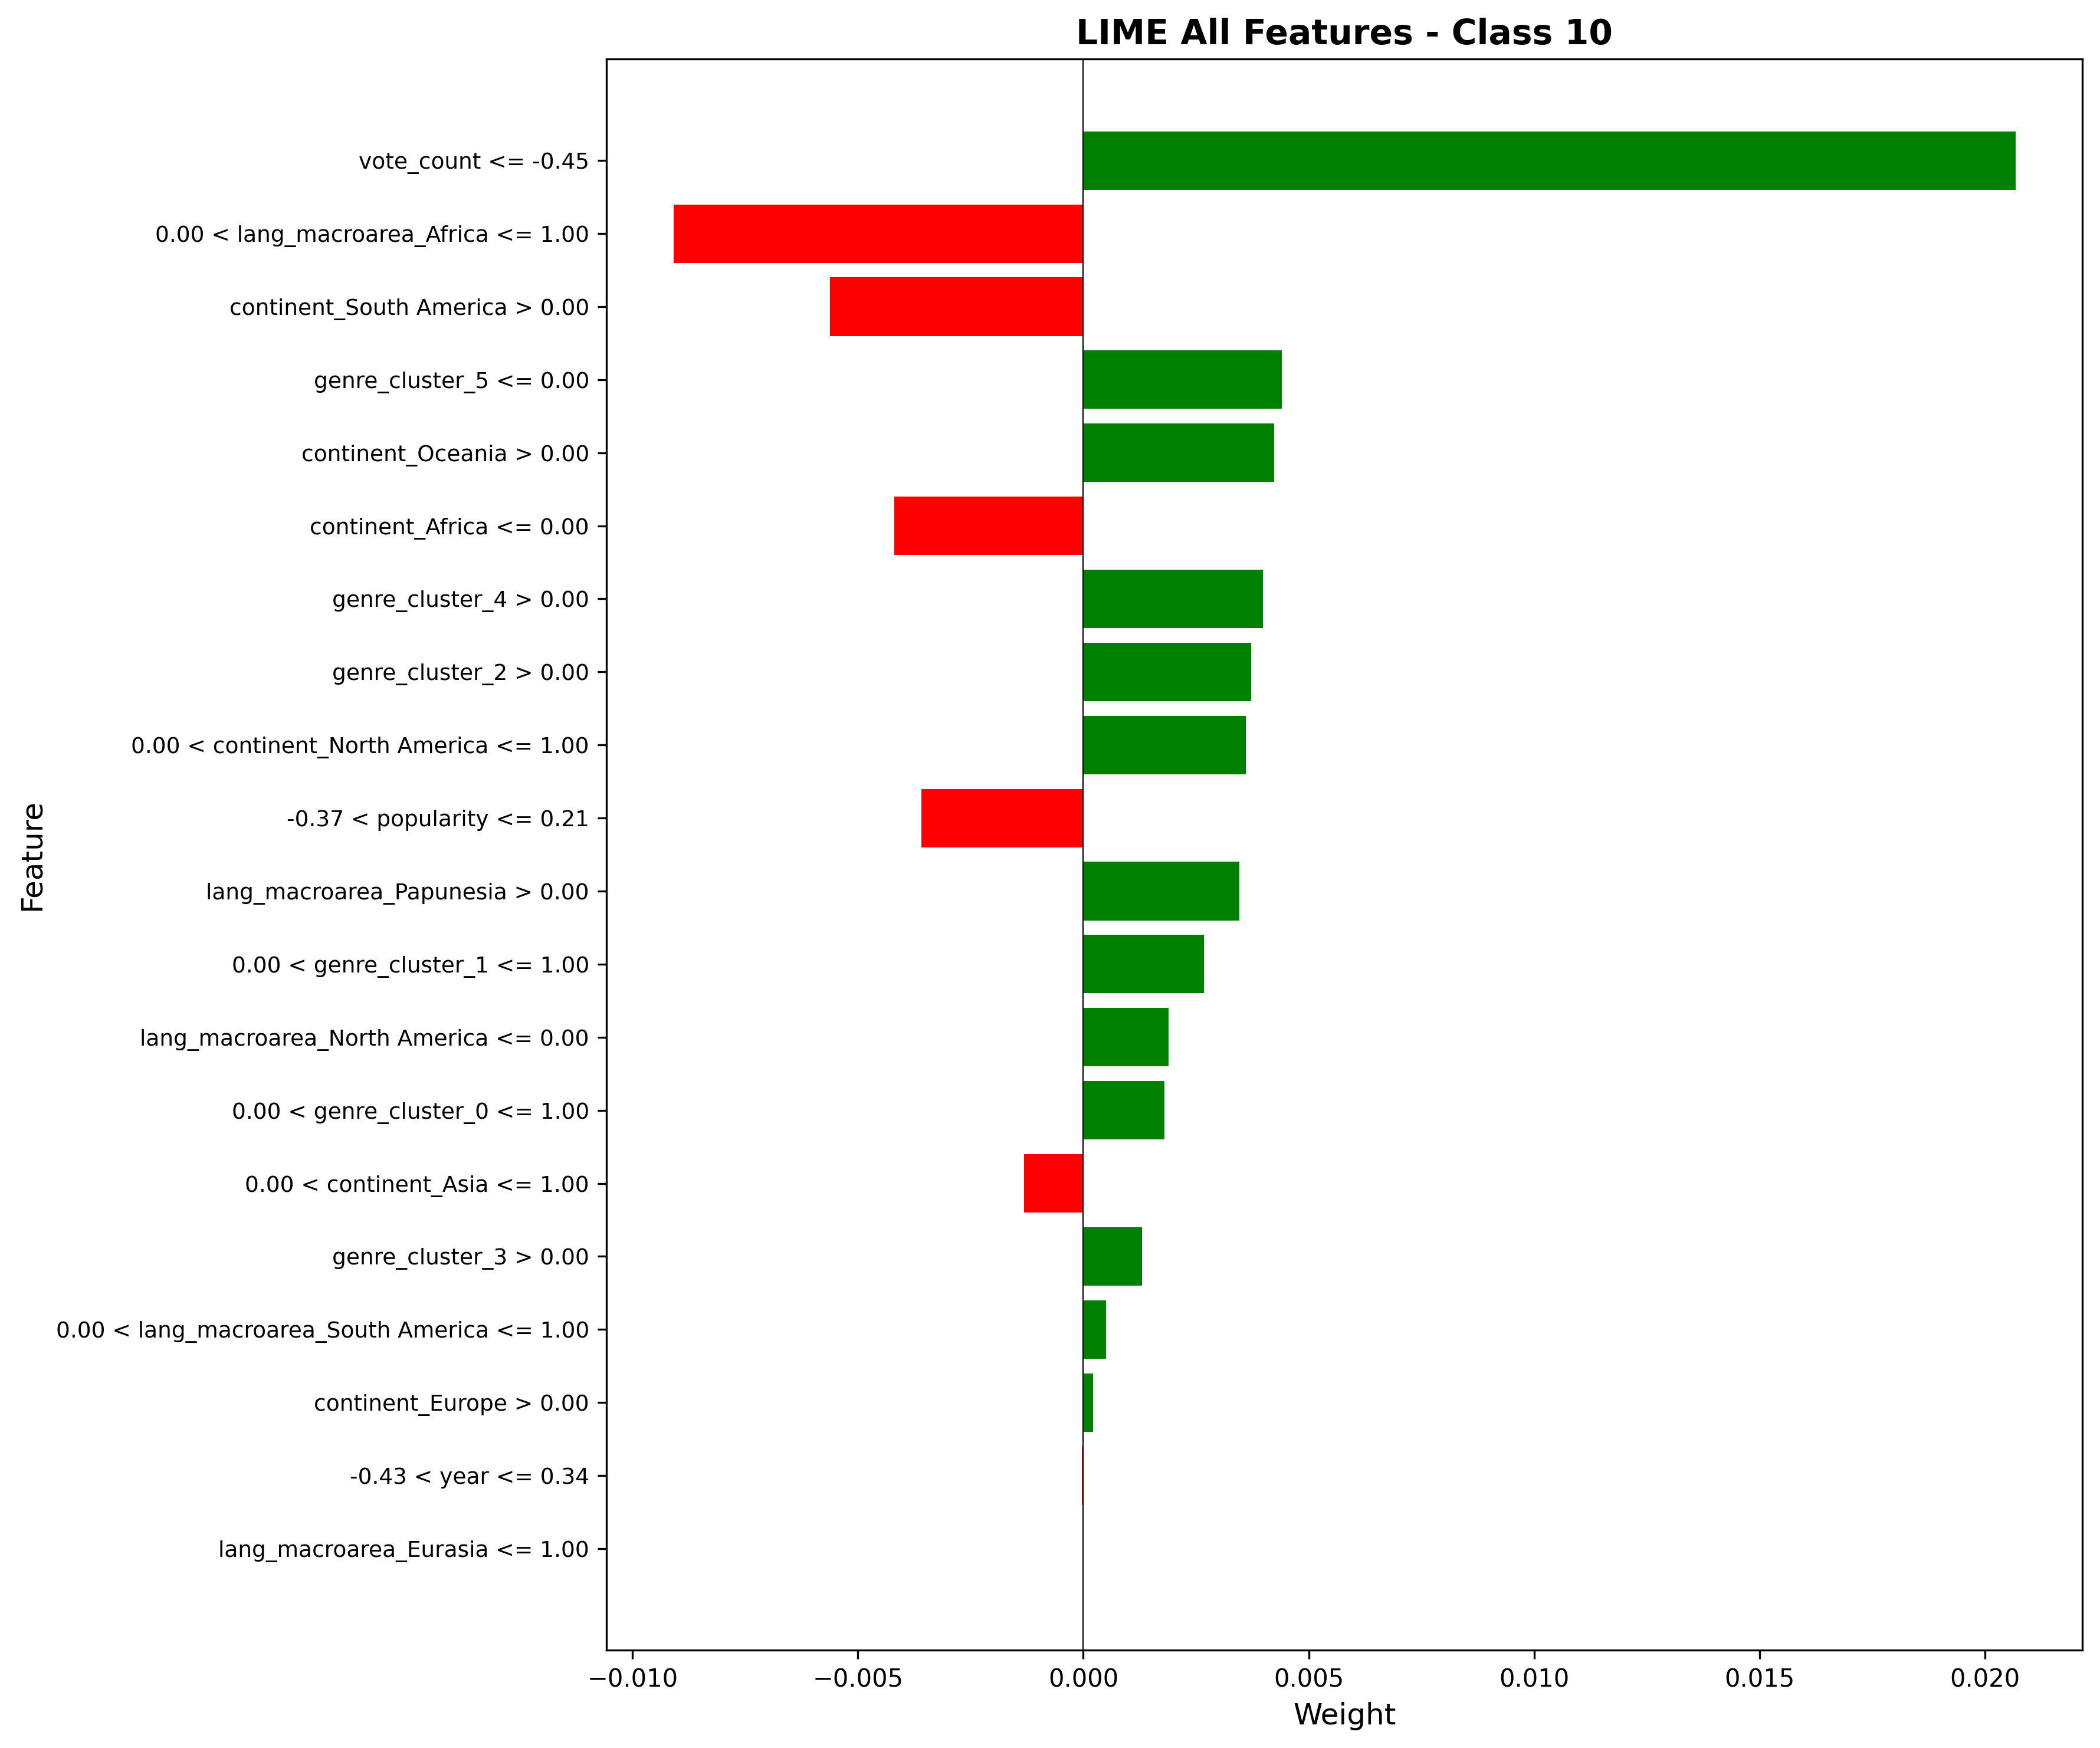
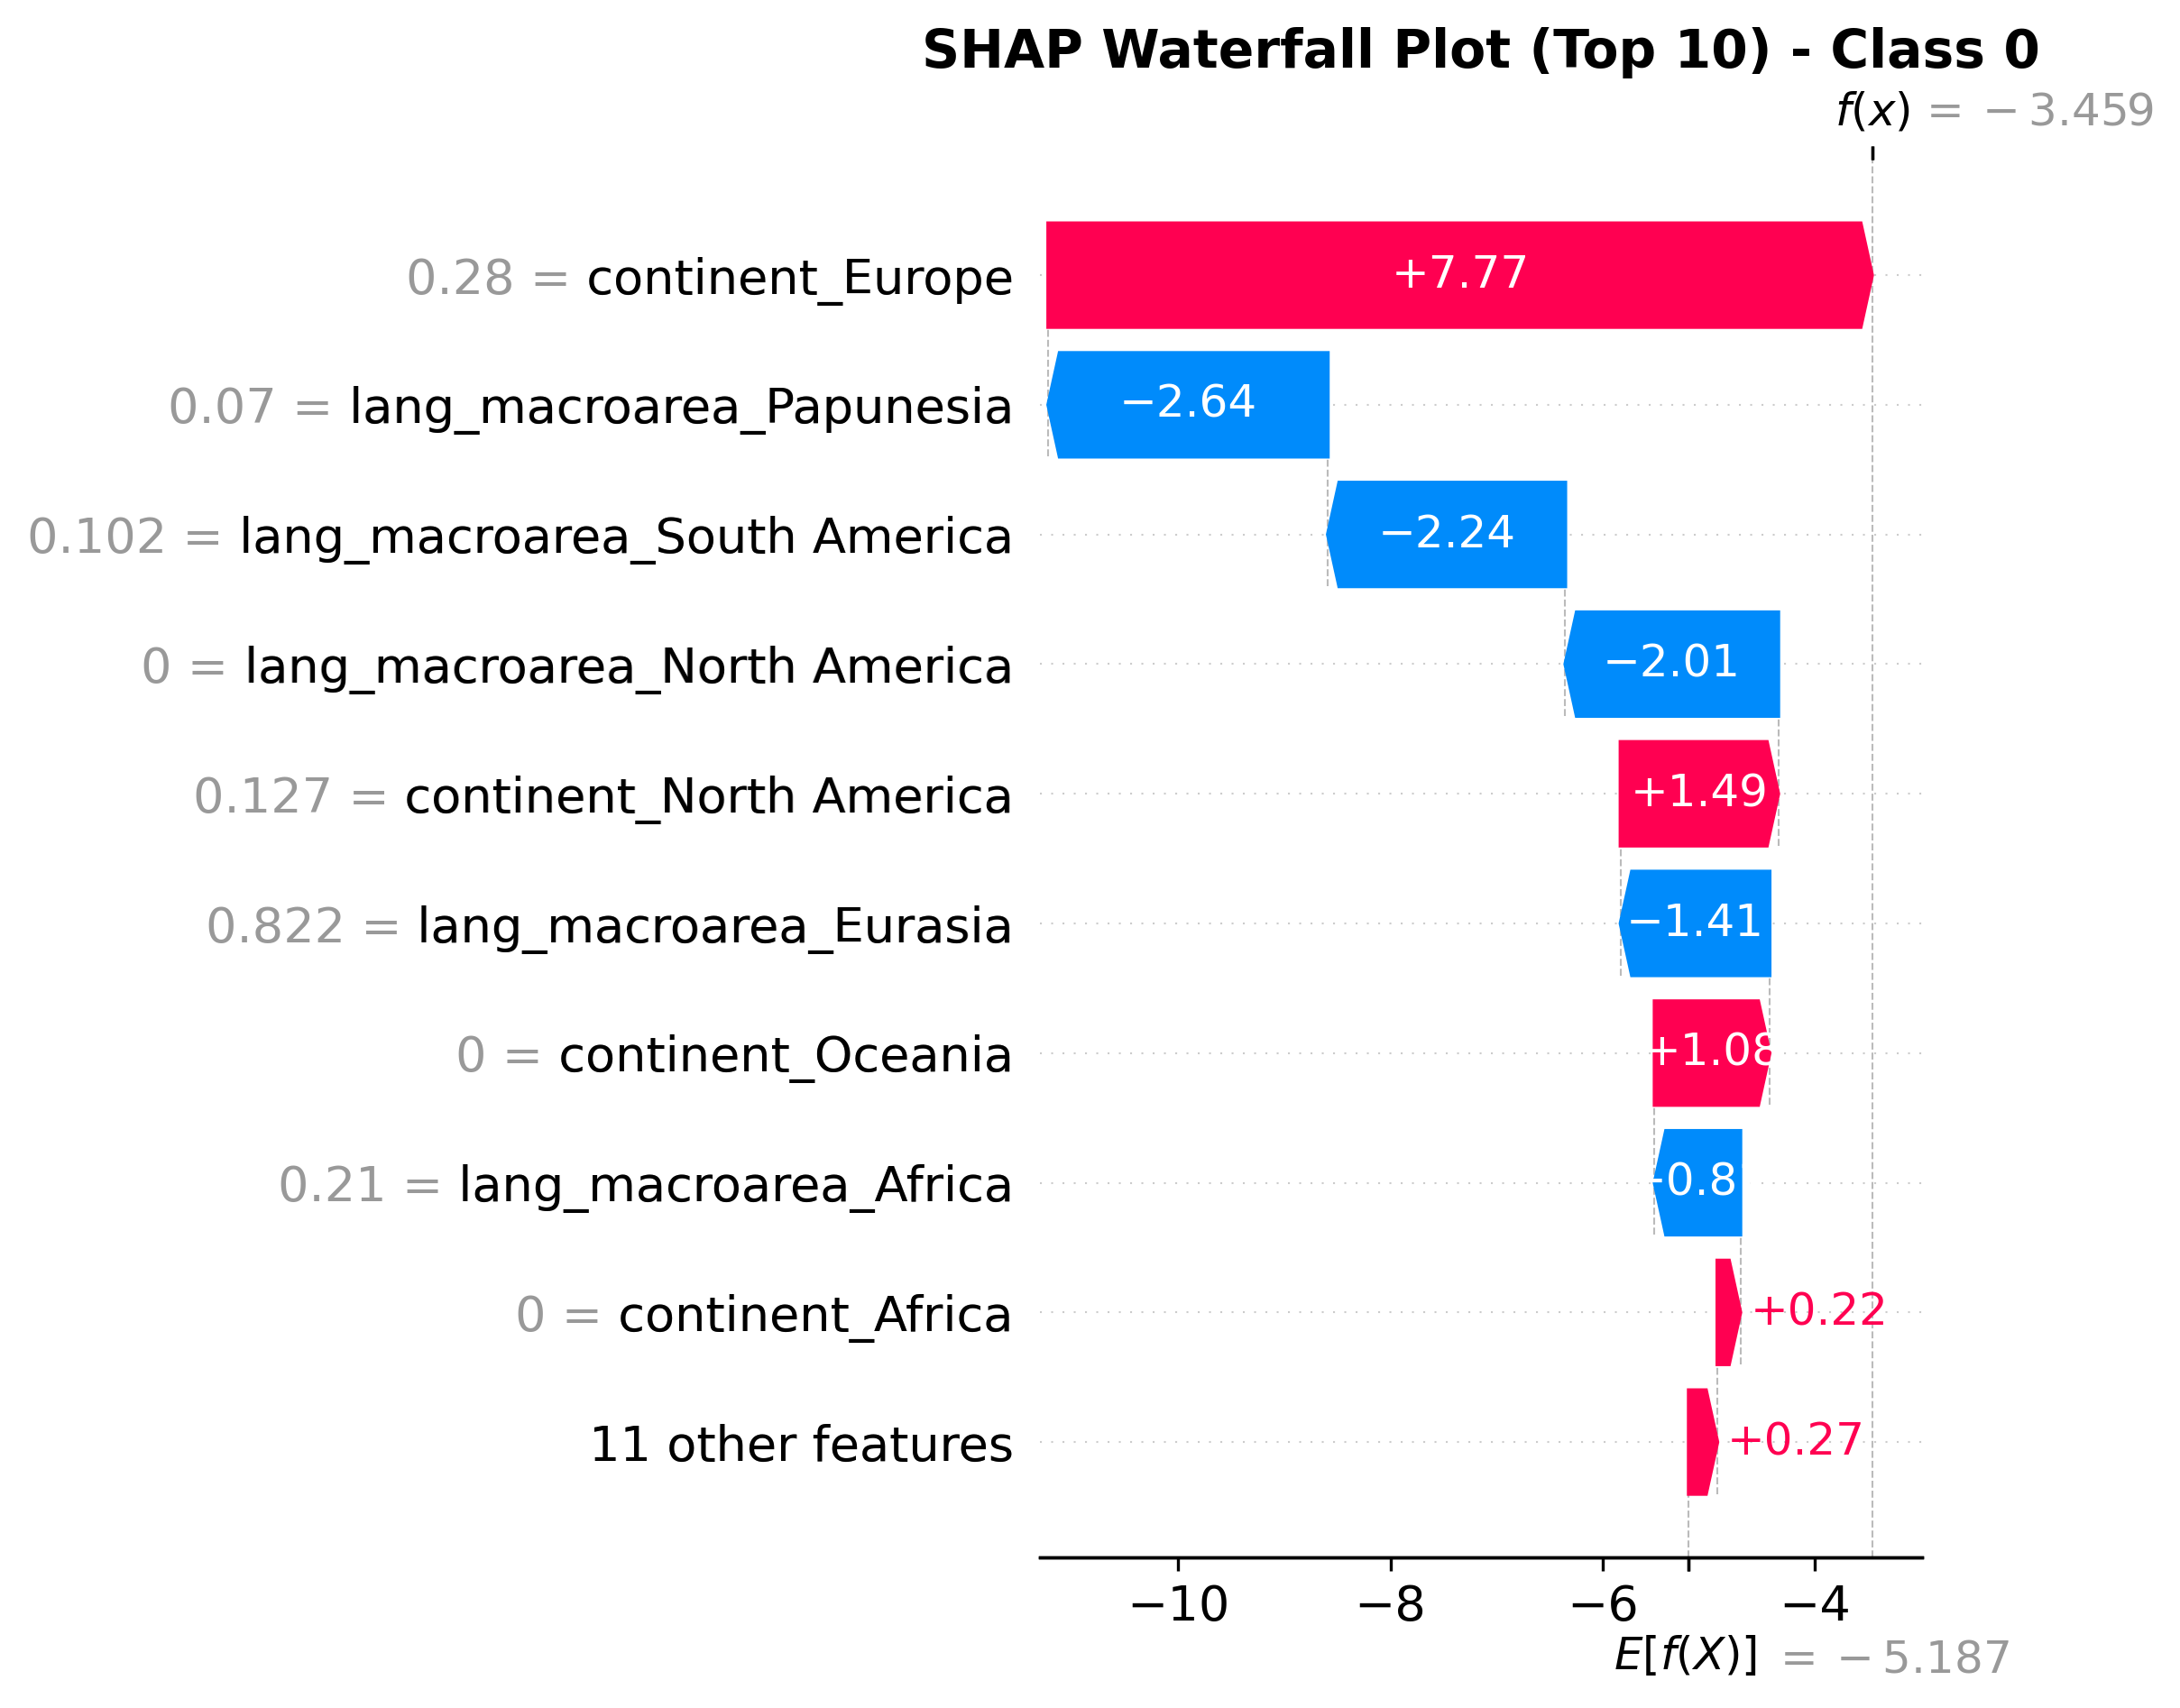
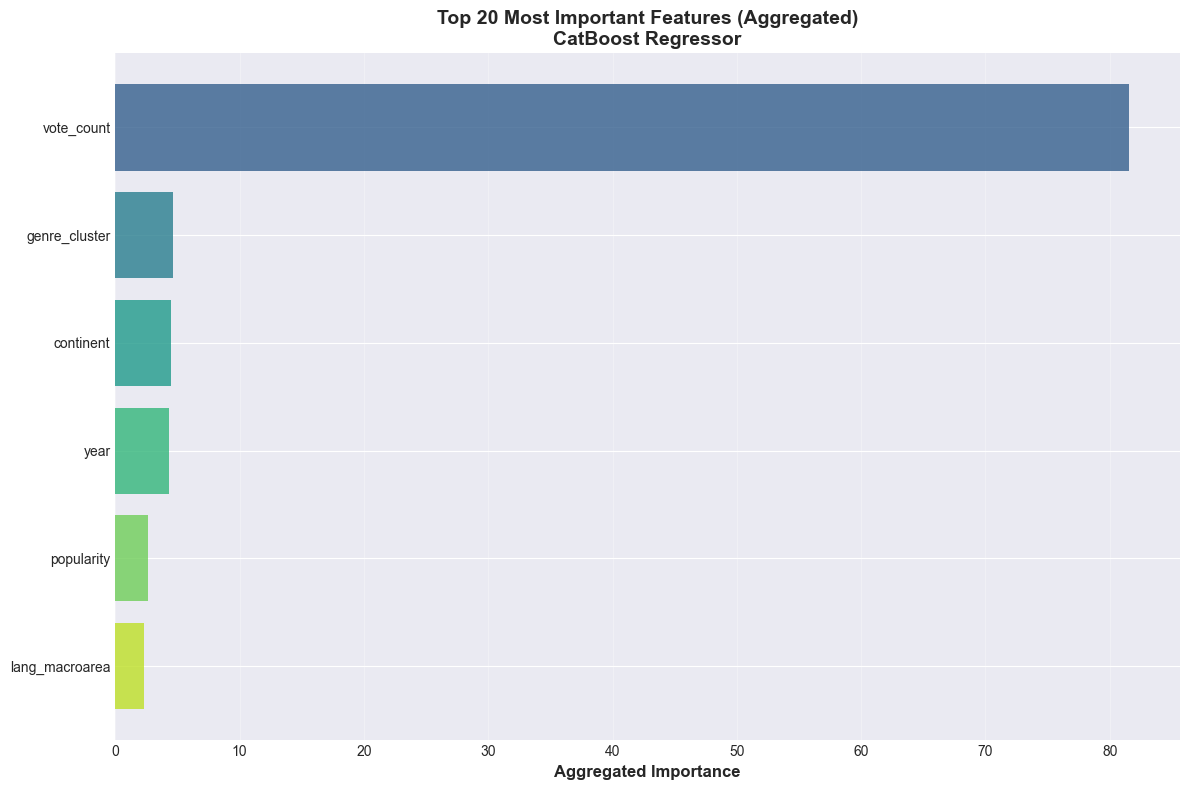
Explainable AI (XAI) Techniques: Implementing both LIME (Local Interpretable Model-agnostic Explanations) and SHAP (SHapley Additive exPlanations) was crucial for model interpretability. Discovering that vote_count was overwhelmingly the most important feature for regression made intuitive sense—polarizing shows get more reviews. The XAI analysis for different rating classes revealed interesting patterns, like European origin being a strong predictor for rating 0, suggesting regional biases in lower-rated content.
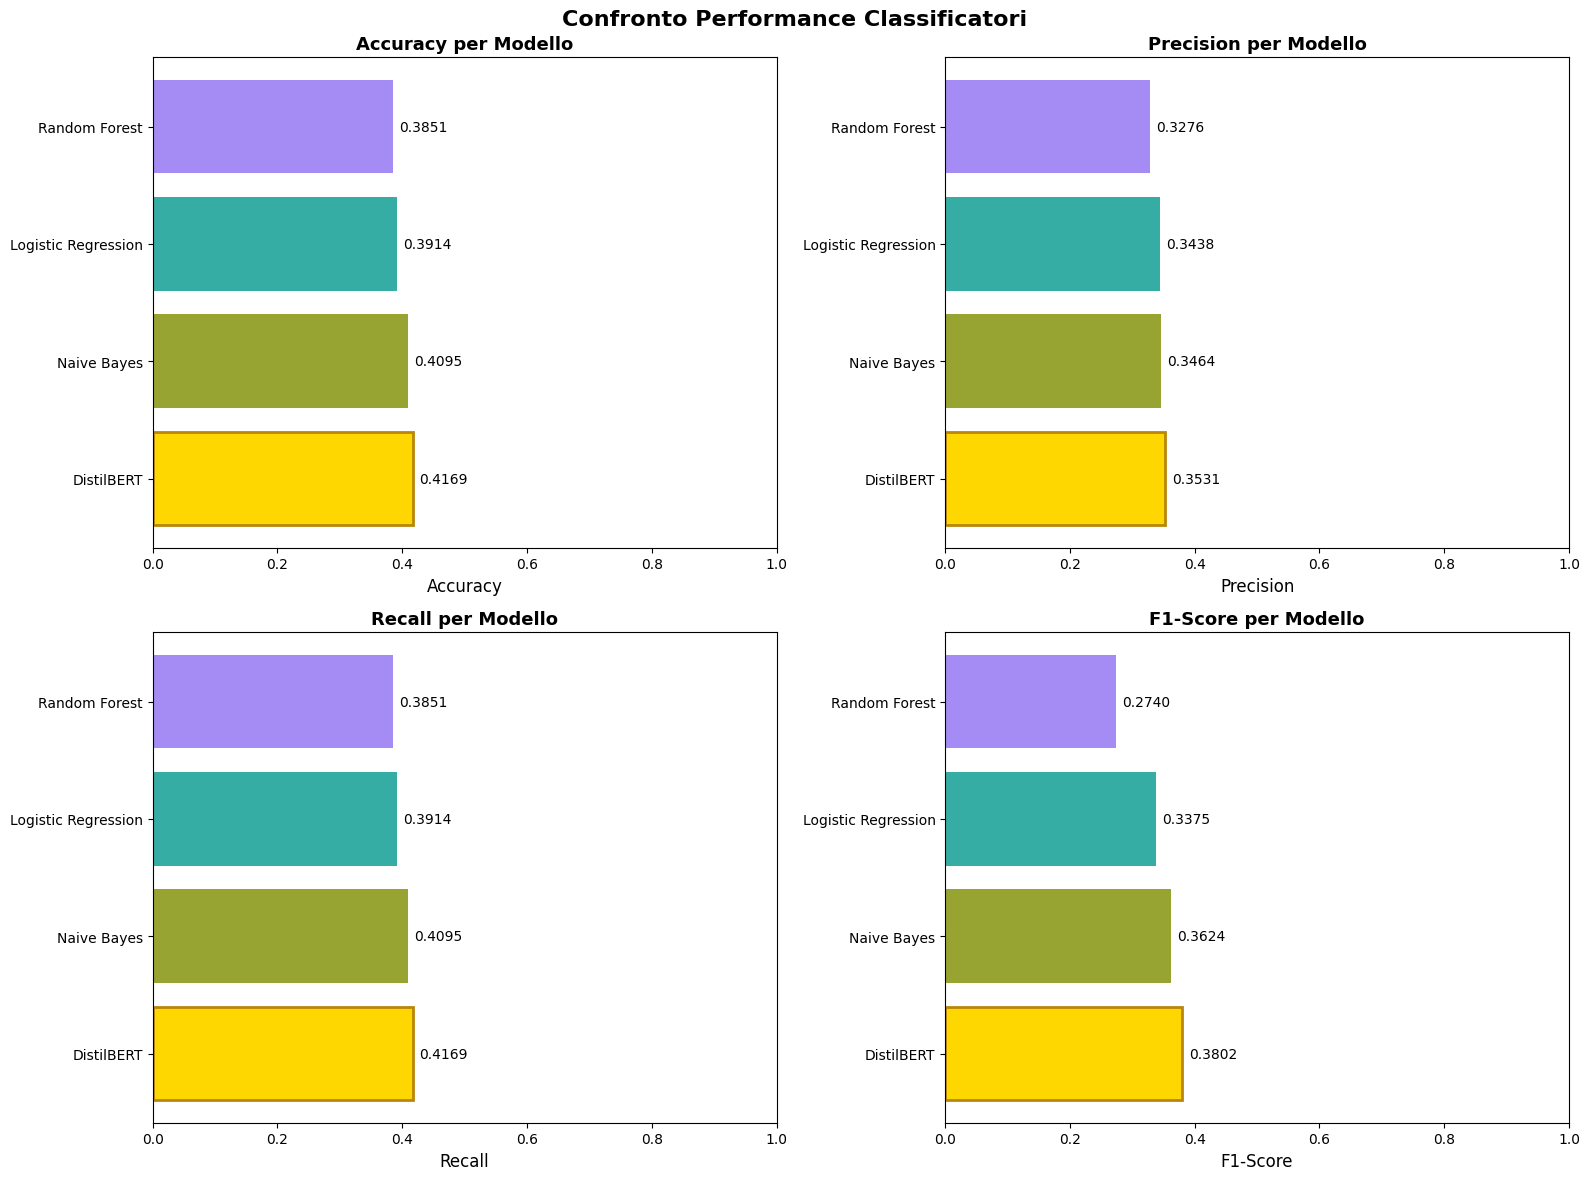
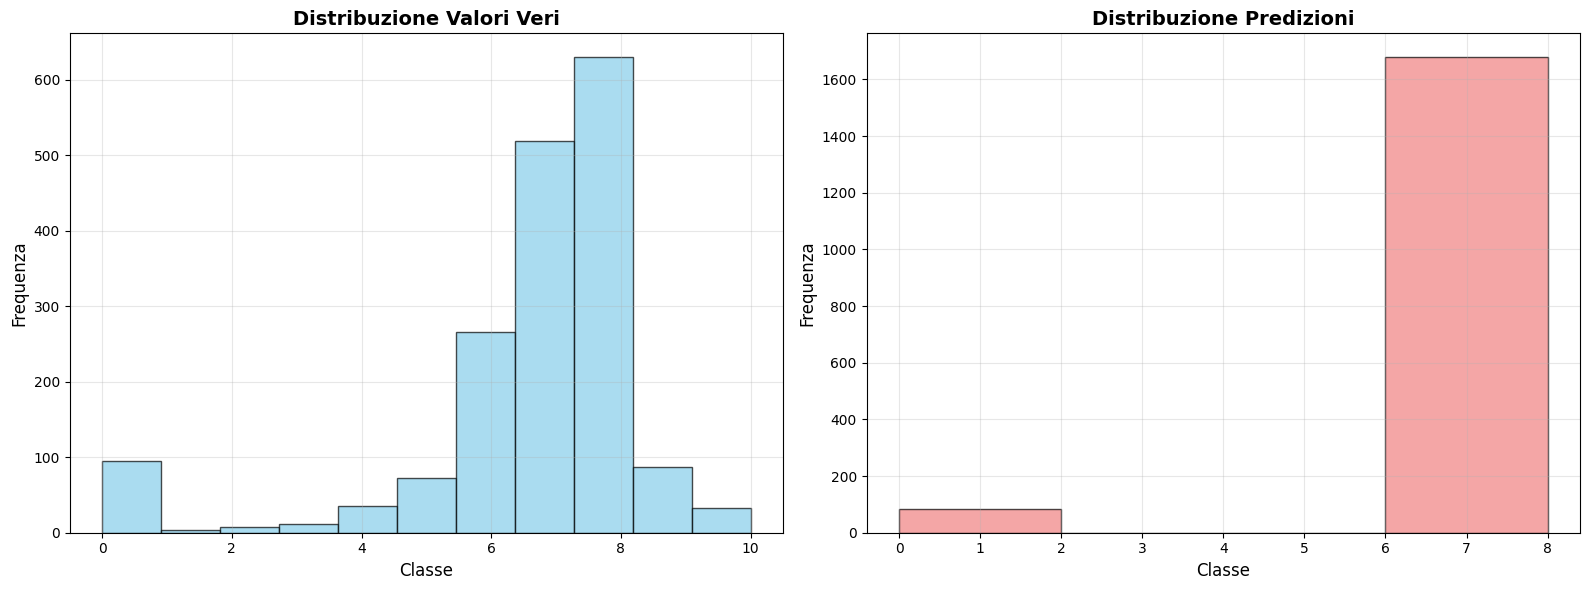
Text Classification with Transformers: The extra work with DistilBERT for sequence classification using show names and overviews introduced modern NLP techniques. While the model achieved decent metrics (42% accuracy), the class distribution analysis revealed it primarily predicted the majority classes (ratings 7-8), highlighting the challenges of applying deep learning to imbalanced datasets without extensive fine-tuning or data augmentation.
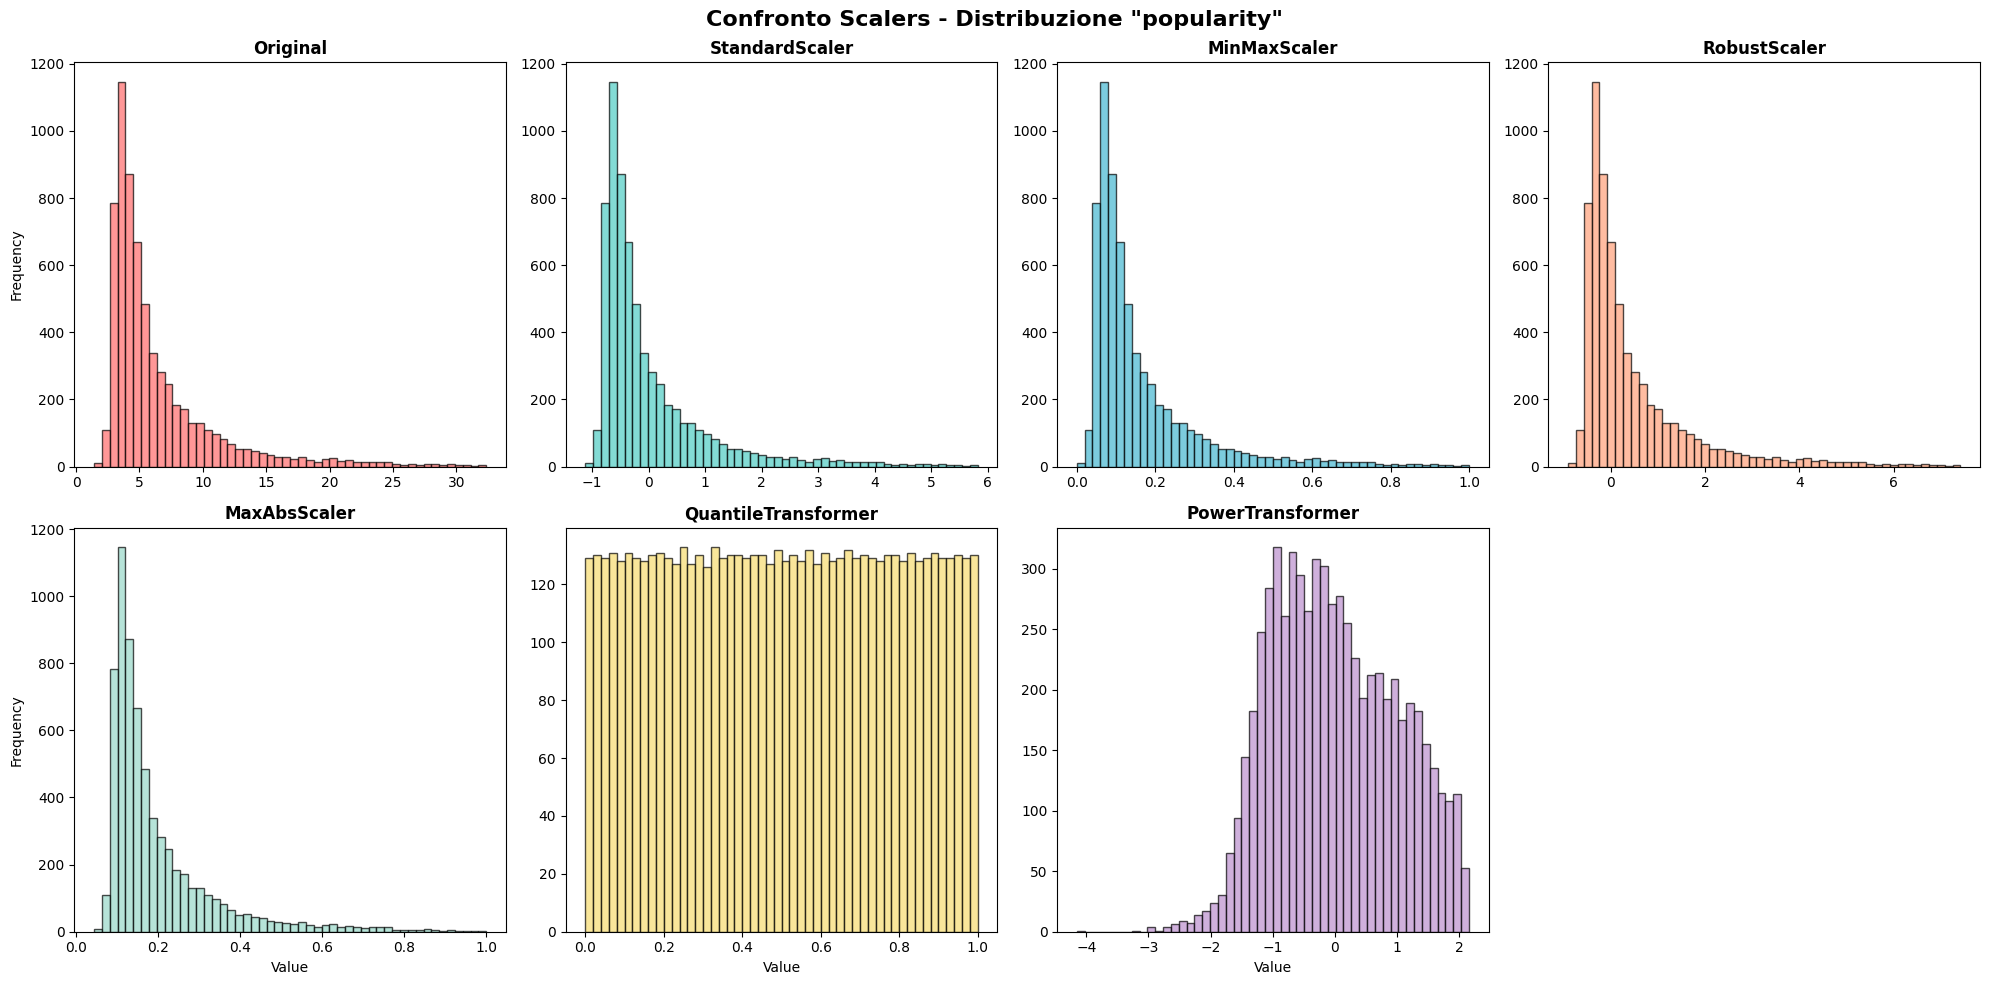
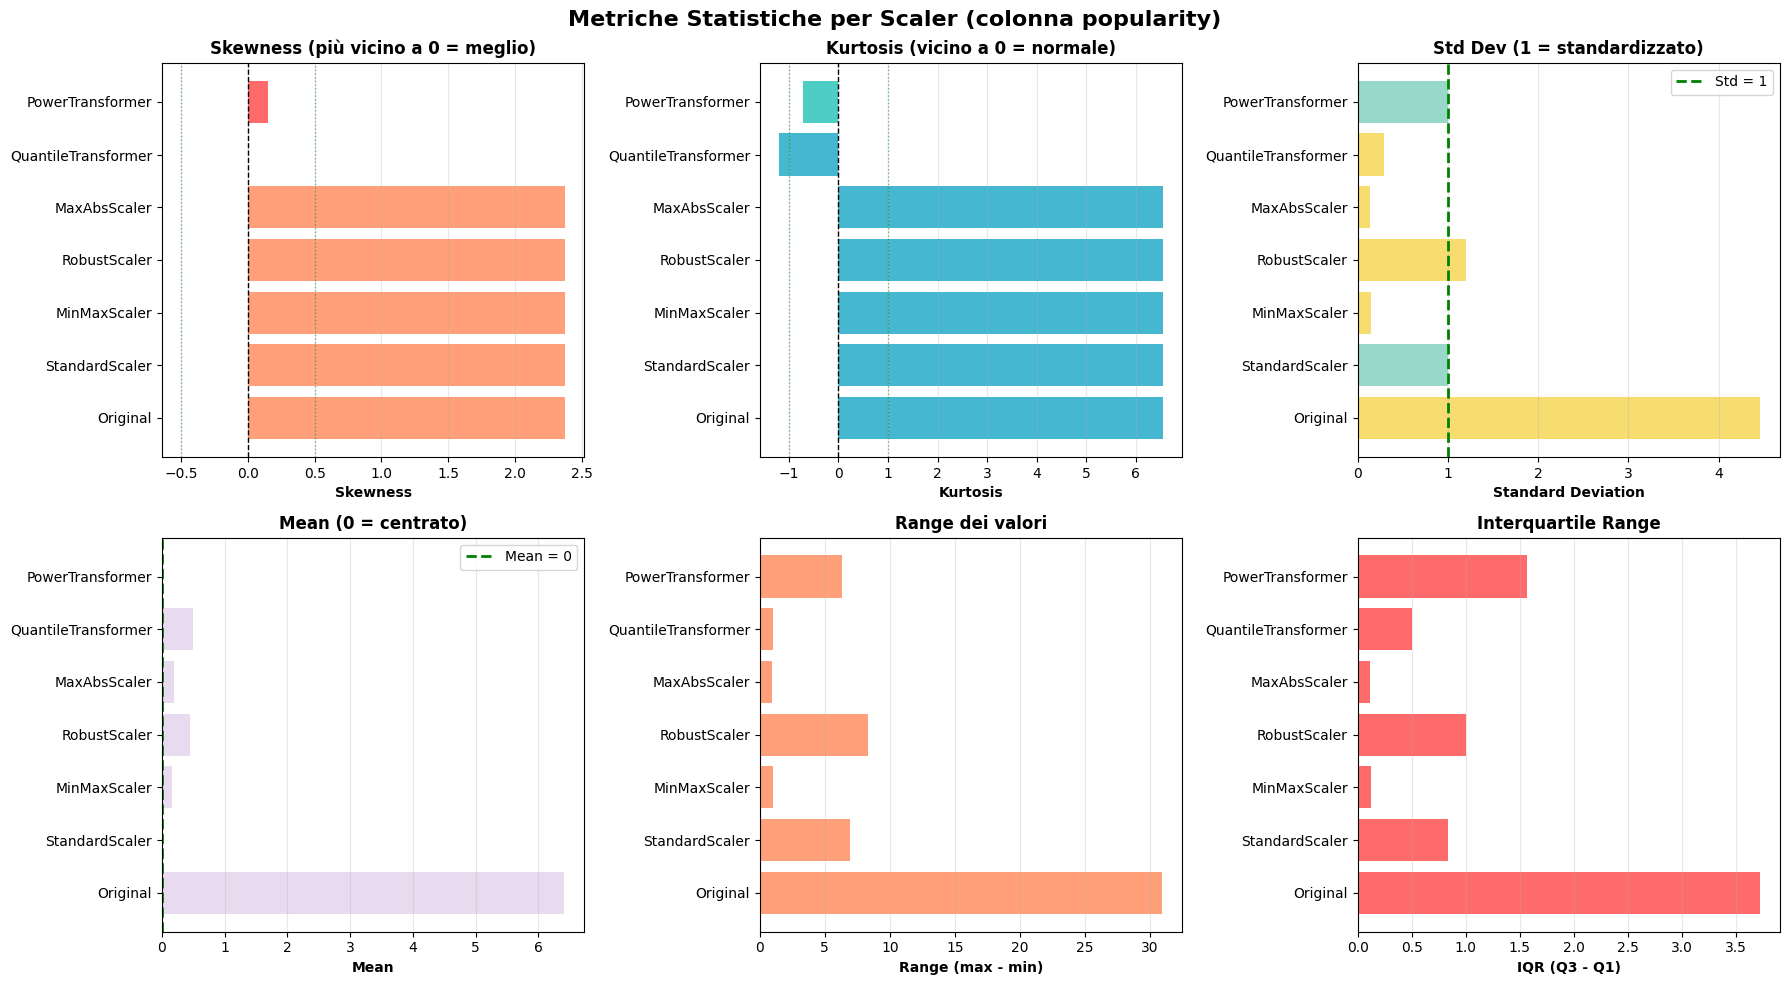
Importance of Data Preprocessing: The project reinforced that data preprocessing often takes more time than modeling but is equally crucial. From API calls to fetch genre mappings, to creating geographical and linguistic groupings, to testing multiple scaling methods (StandardScaler proved optimal over MinMaxScaler, RobustScaler, PowerTransformer, and QuantileTransformer), each preprocessing decision impacted final model performance significantly.