This project addresses the VAST Challenge 2023 Mini-Challenge 1, focused on combating illegal, unreported, and unregulated (IUU) fishing. FishEye International, an organization dedicated to protecting marine species, gathers online news articles about fishing and the marine industry. Using natural language processing, they extract entities and relationships to create a knowledge graph for investigating suspicious activities.
The challenge was to develop an interactive visual analytics tool that helps analysts explore contextual information around suspected entities without being overwhelmed by data. The tool needed to be dynamic and interactive, emphasizing relevant connections to identify companies potentially engaged in illegal fishing.
Four specific entities were designated for investigation: Mar de la Vida OJSC, 979893388, Oceanfront Oasis Inc Carrie, and 8327. The visualization was built using JavaScript and D3.js to create an interactive network graph with multiple exploration features, allowing analysts to discover patterns and relationships that might indicate illegal fishing activities.
A live version of the project is aviable here
This project marked my first experience with the D3.js library, which revealed very helpful for my Master Thesis's project. The reliance solely on JavaScript for data manipulation limited options and made the process less efficient compared to using a dedicated API as i was used while working.
The most challenging aspect was the initial data exploration phase. Without a clear pattern identified beforehand, the project evolved into building a comprehensive "toolbox" for visual data exploration. This approach taught me that effective visual analytics can emerge through iterative development and user interaction rather than being limited to predetermined analysis.
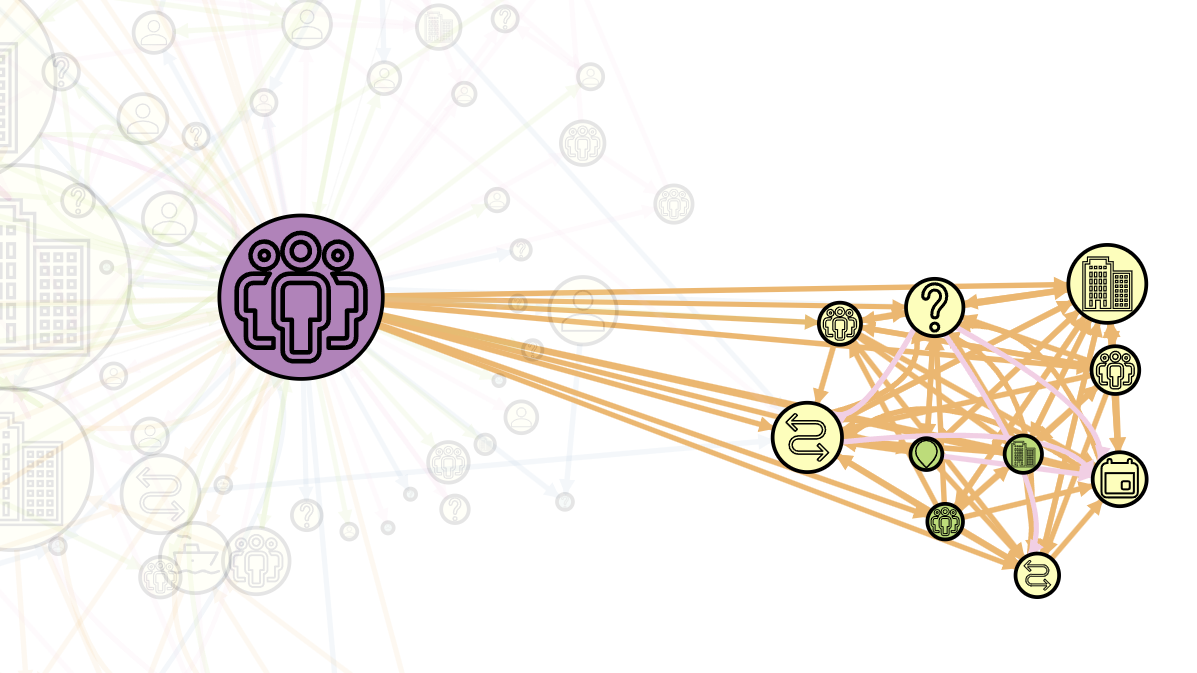
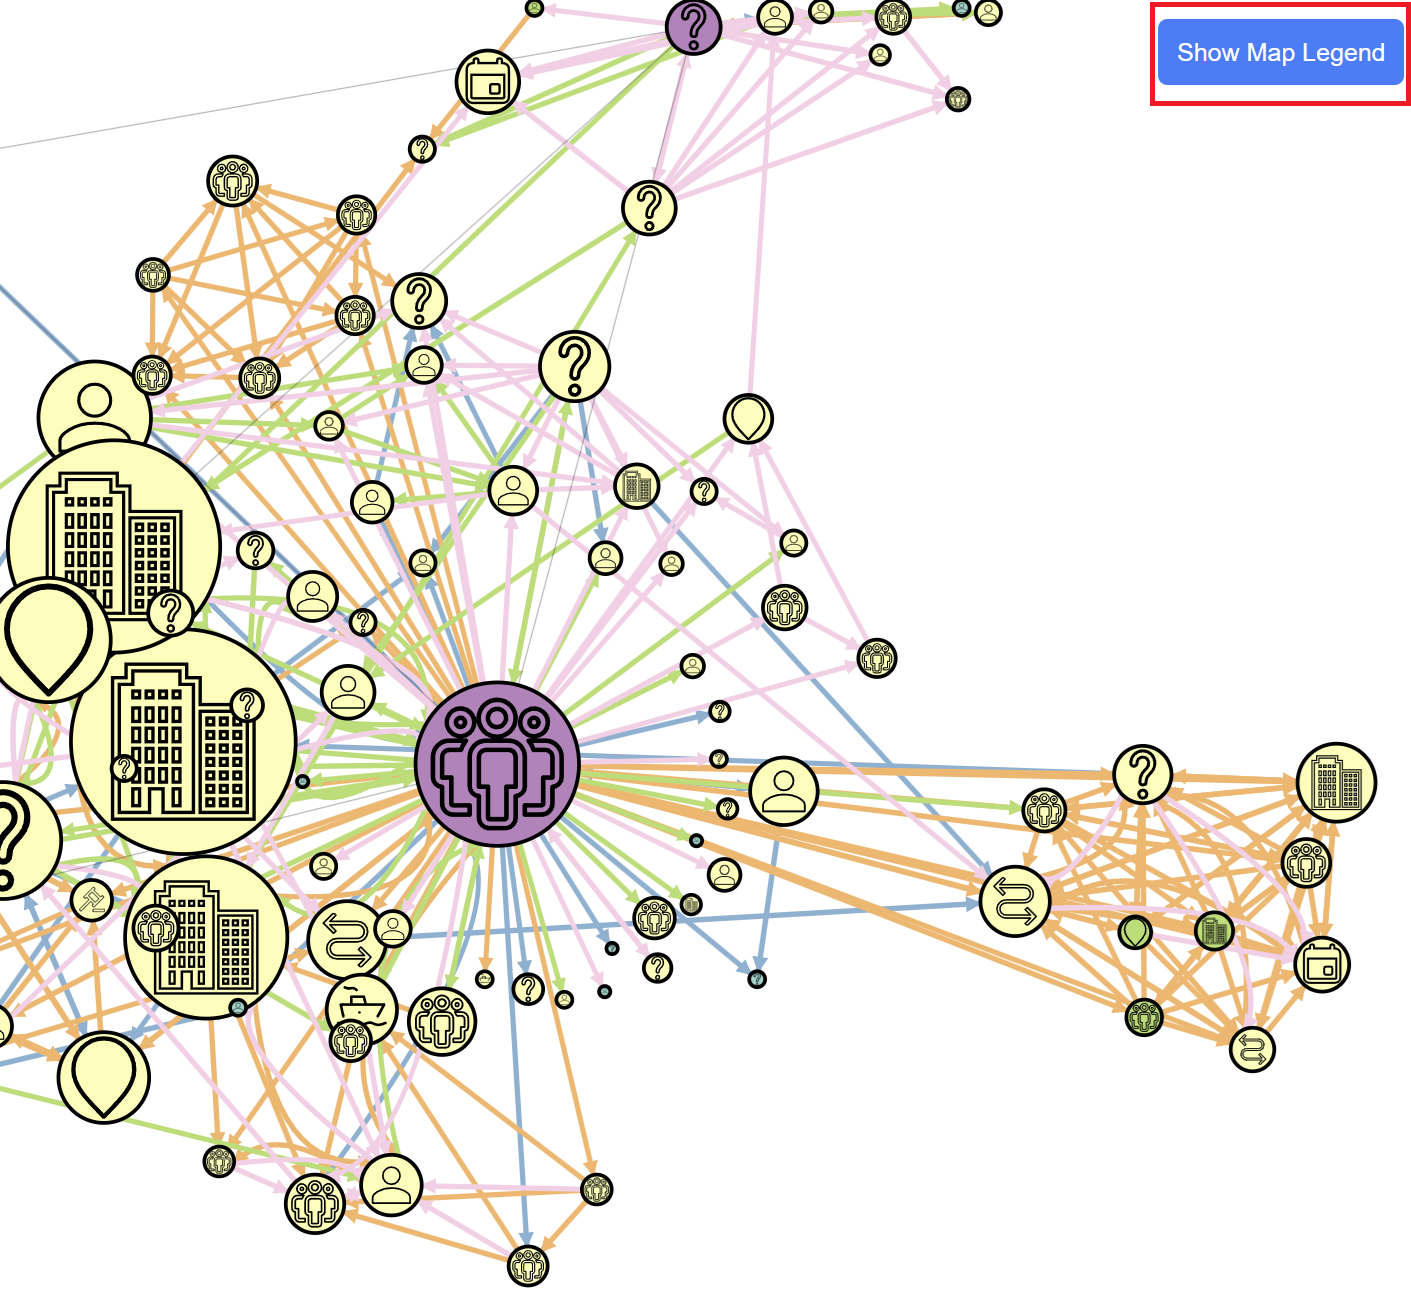
Through visual exploration, I learned to identify key patterns indicating potential illegal activity: highly interconnected clusters of entities and nodes with numerous incoming and outgoing connections. The entity 979893388 emerged as a central node connected to multiple clusters, particularly through partnership links, revealing a network of major entities including Mar del Oeste Pic, Ocean Fisheries Llc, and SeaSpray Wave SRL Solutions.
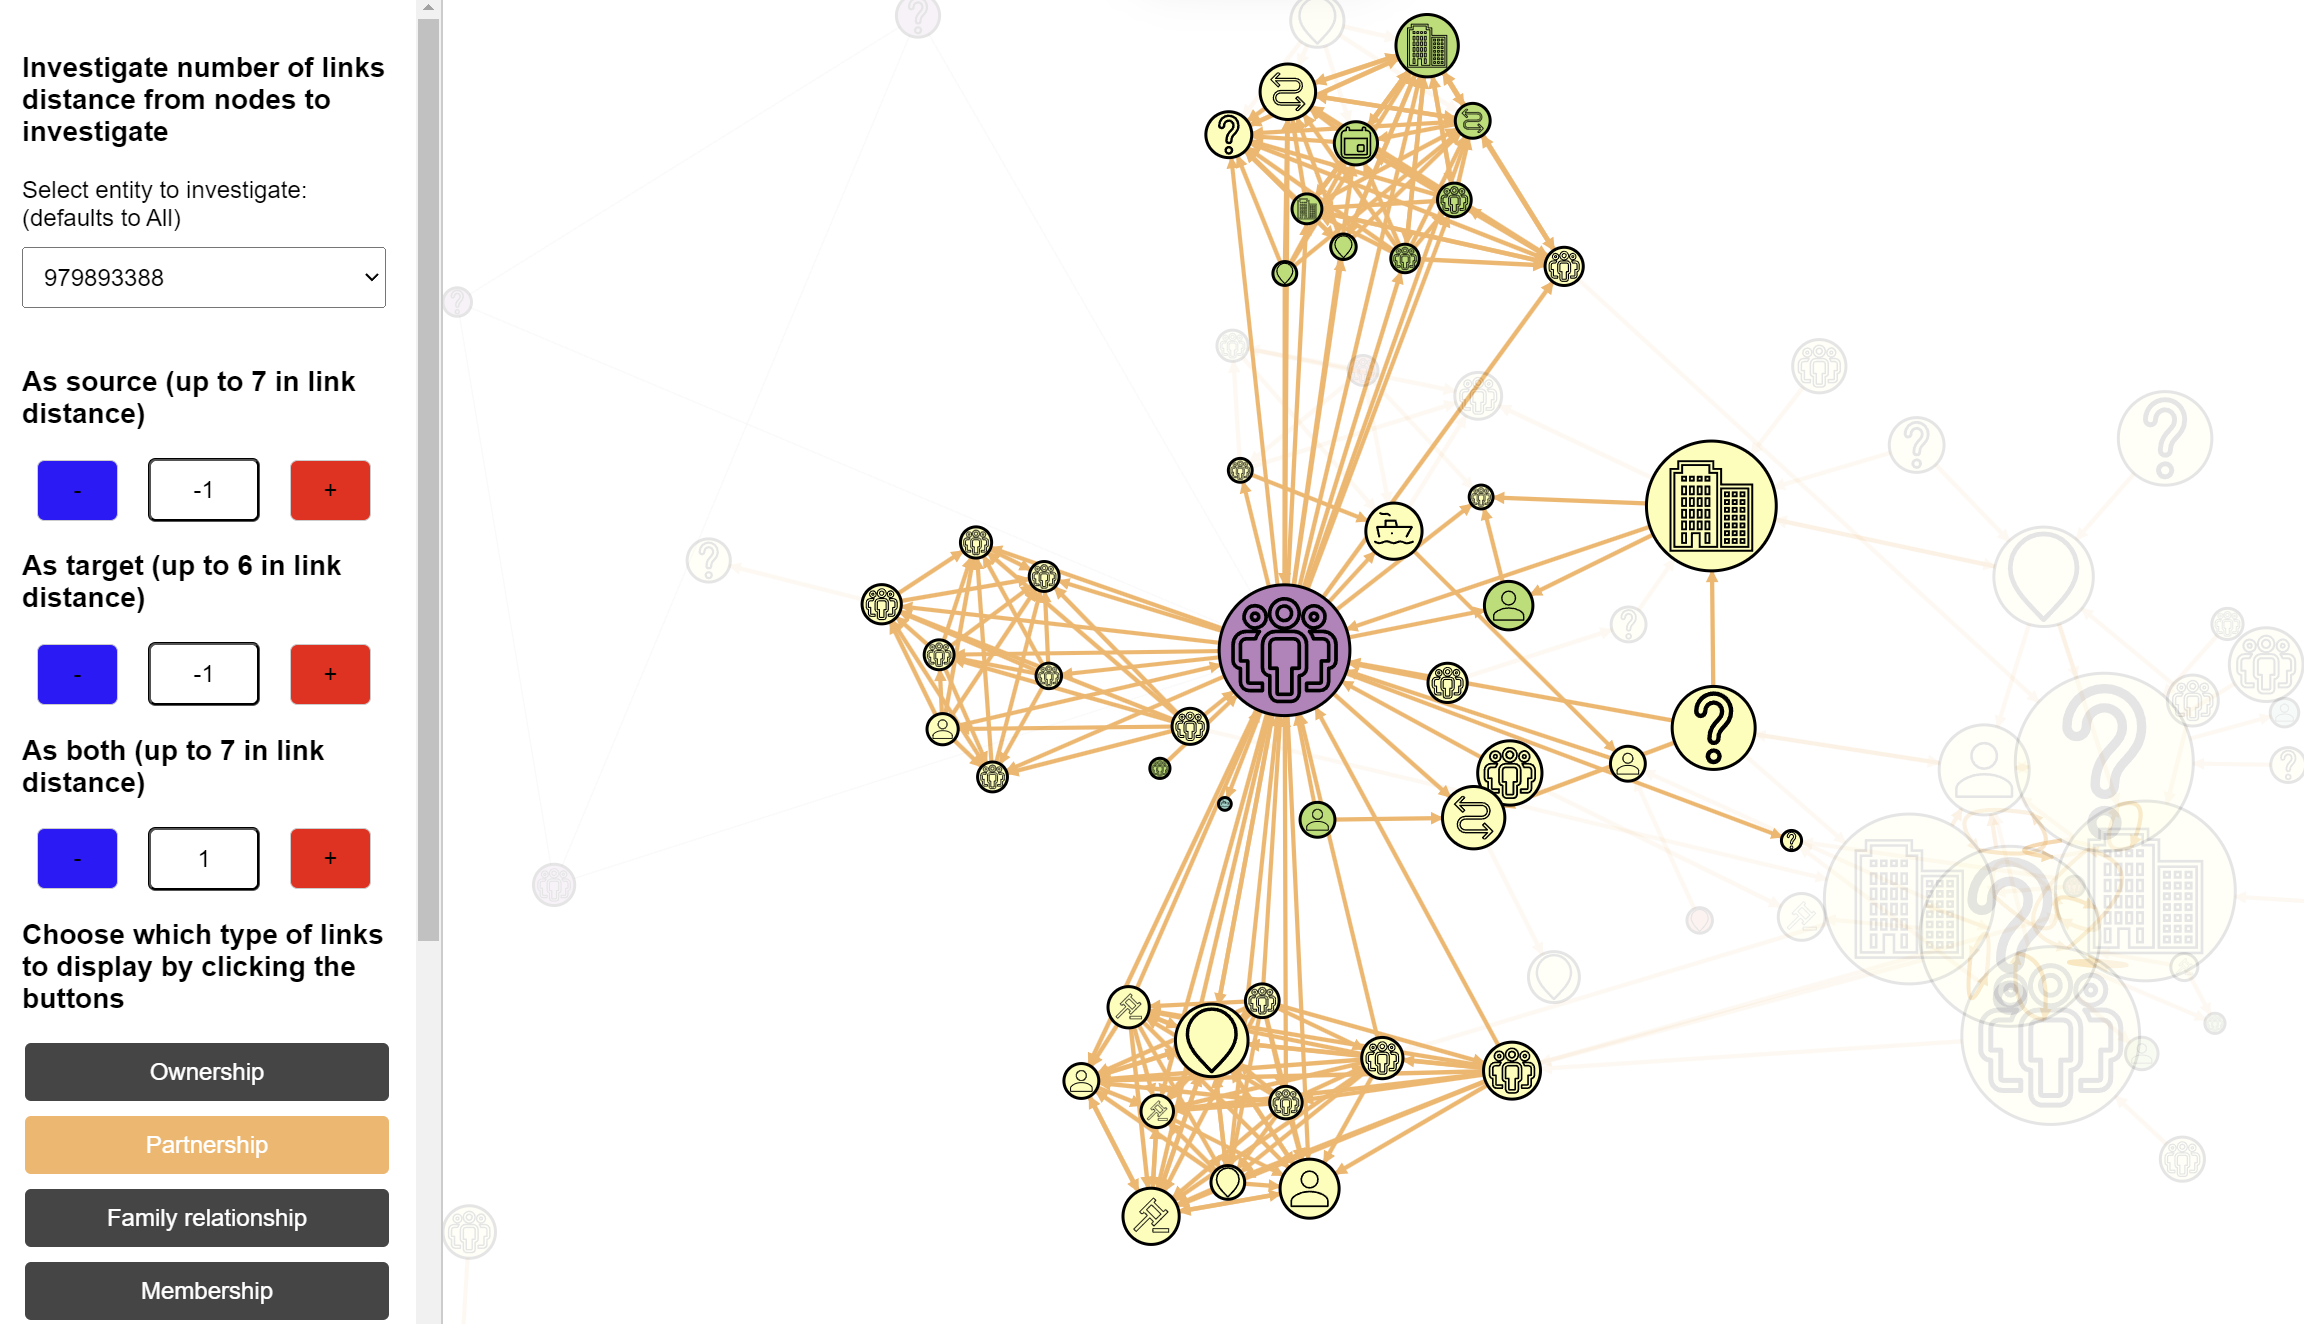
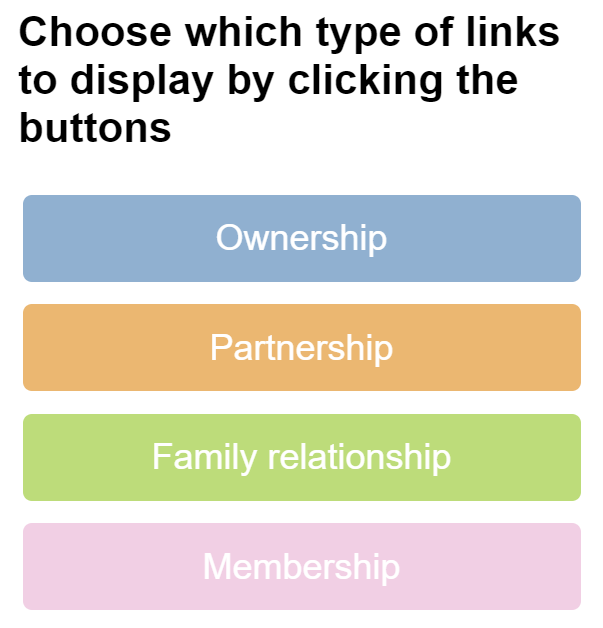
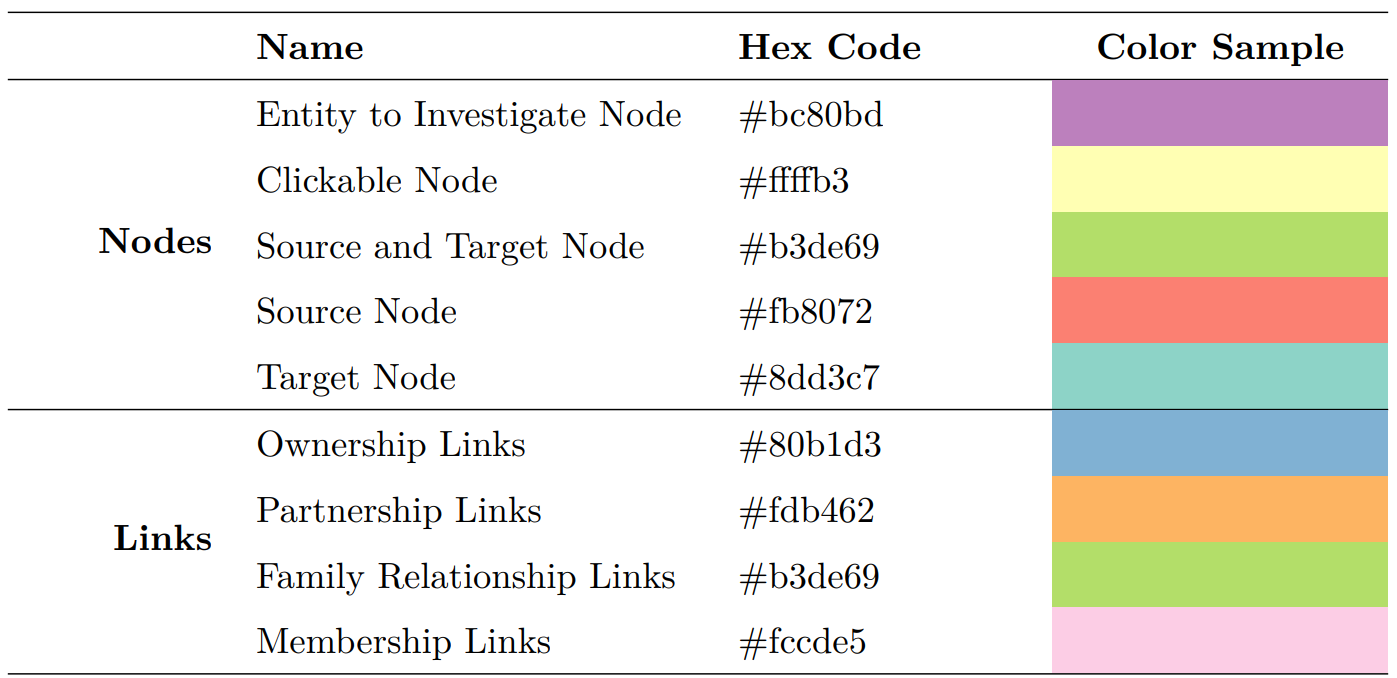
Selecting an appropriate color palette was crucial for intuitive navigation. Using ColorBrewer 's qualitative scheme with nine distinct colors, I learned to balance visual clarity with information density. Colors distinguished between node states (entity to investigate, clickable nodes, sources, targets) and link types (ownership, partnership, family relationship, membership).
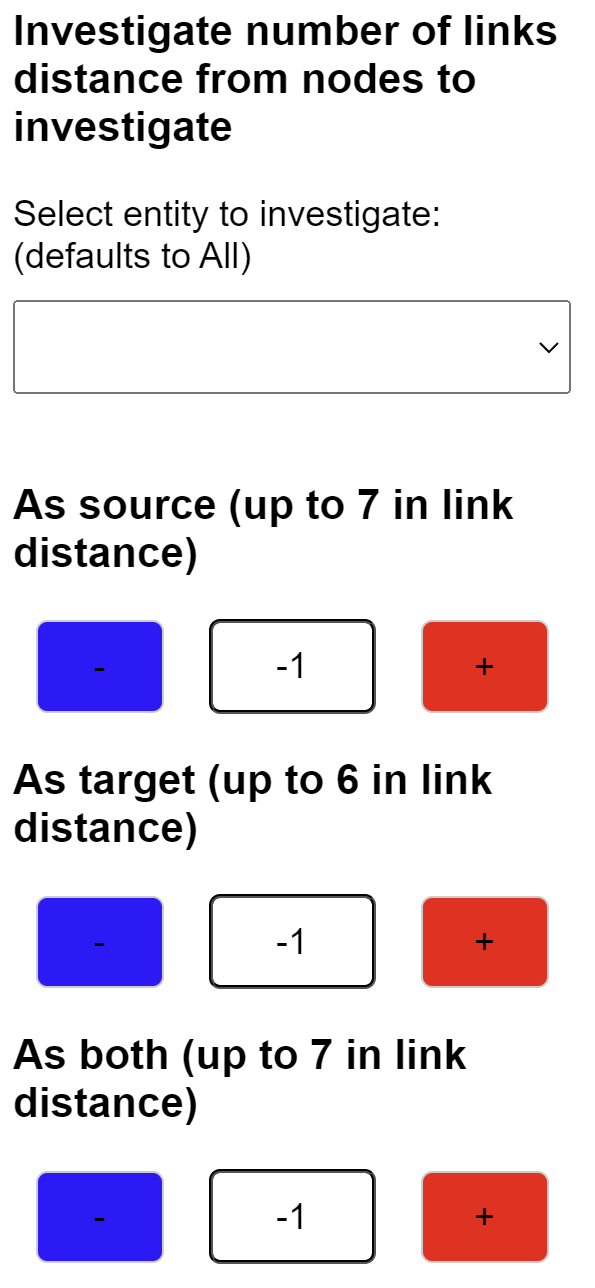
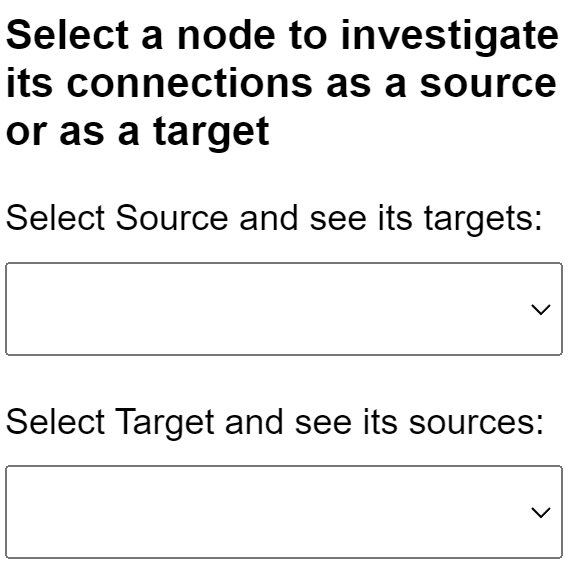
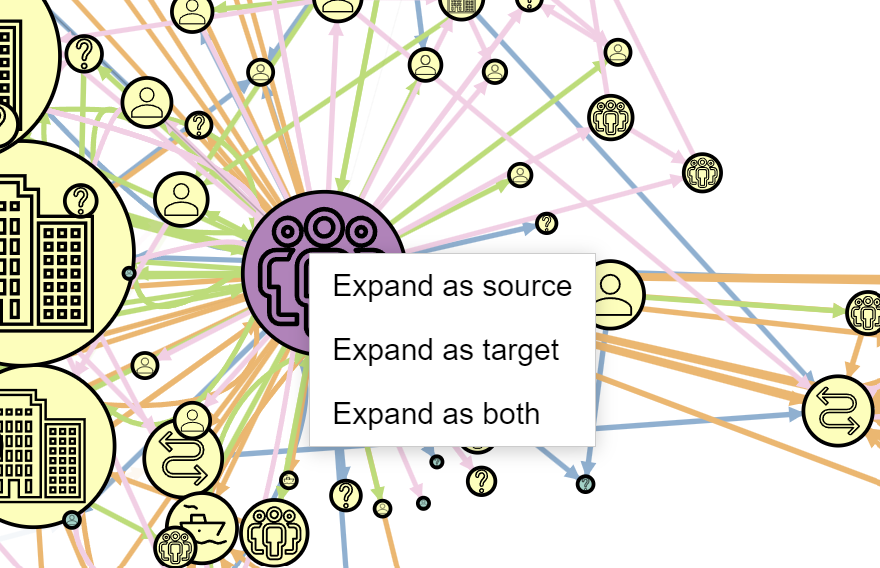
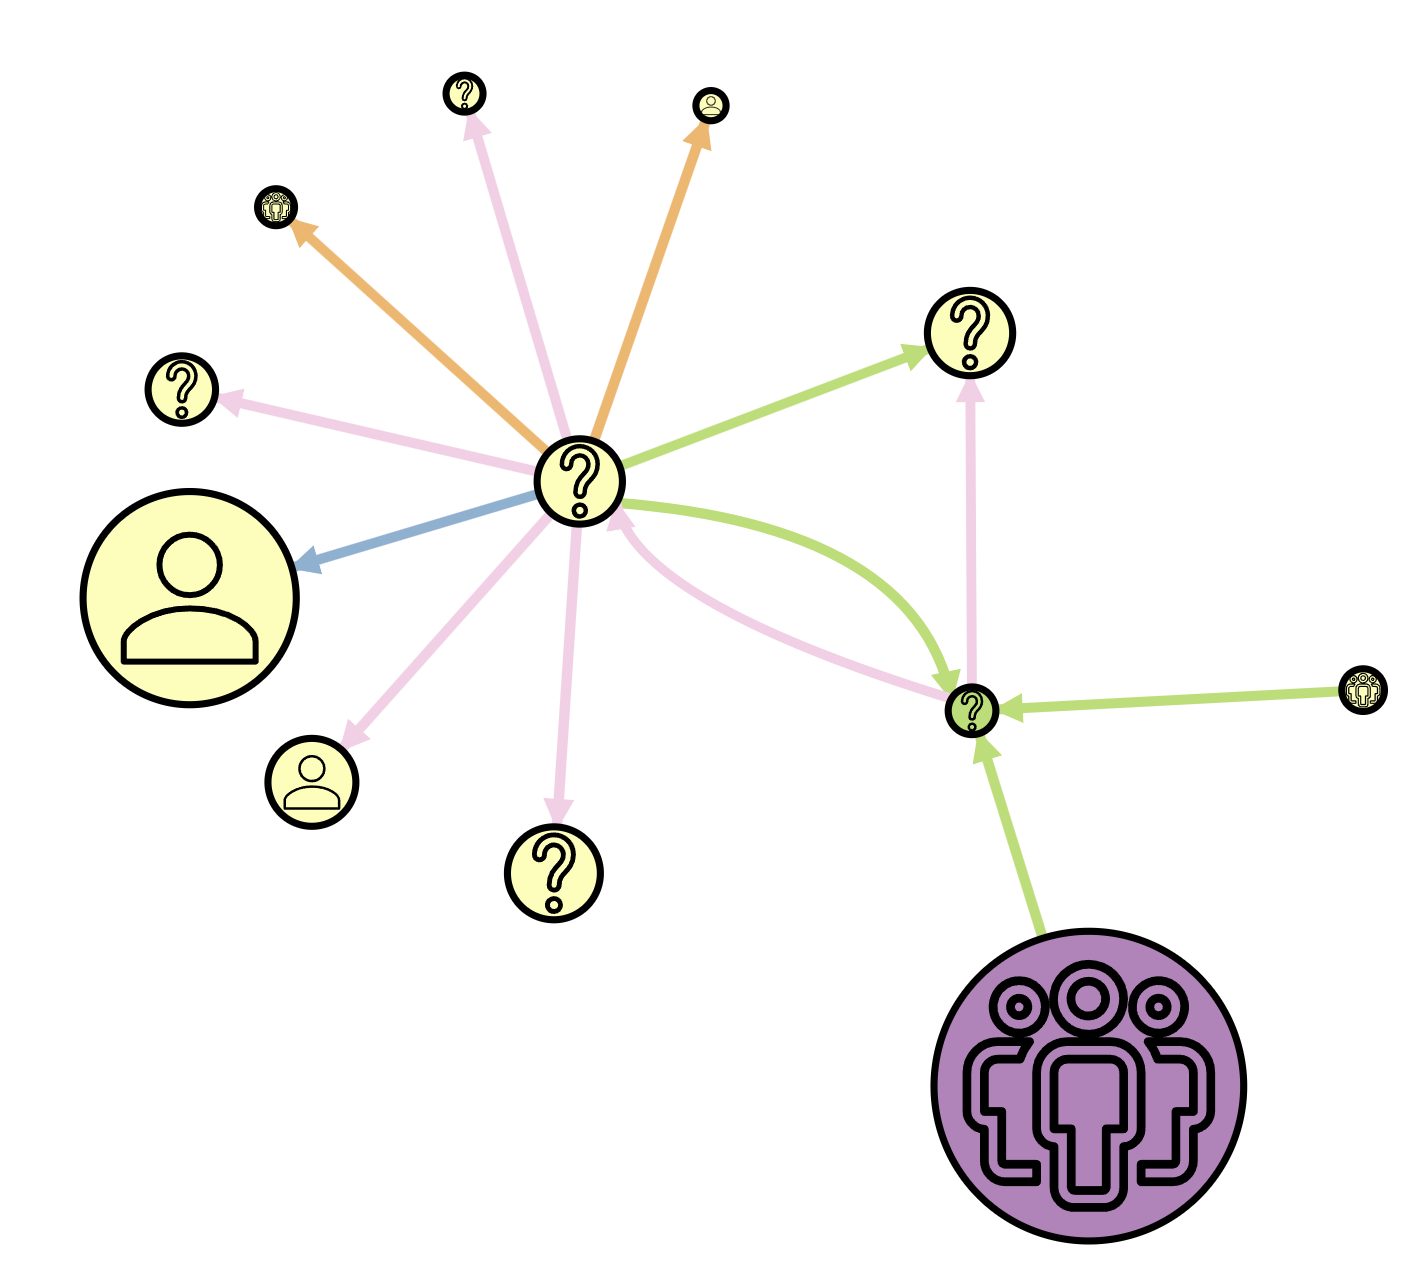
Implementing multiple interaction methods taught me about progressive disclosure in UI design. The left panel provides filtered views and distance-based exploration, left-clicking highlights immediate connections, right-clicking expands nodes to reveal sources or targets, and hovering displays detailed tooltips. Each interaction serves a specific analytical purpose without overwhelming users.
Creating the "link distance n" concept (you can read about it in the report) allowed for systematic network traversal, defining distance as the number of links needed to reach other nodes from an origin.